Diagram rulers scale problem

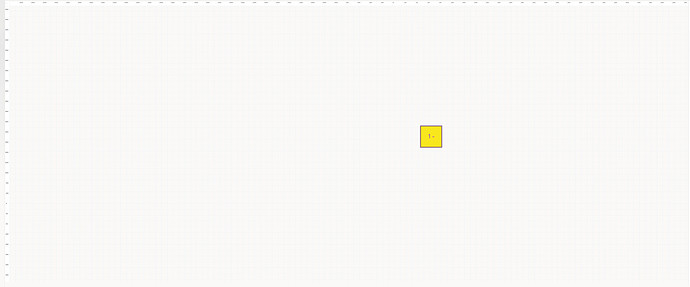
When the diagram is scaled, the ruler becomes very small, what is the reason?
how do i solve this problem?

Thanks.

                var gradScaleHoriz =
                    GO(go.Node, "Graduated",
                        {
                            graduatedTickUnit: 10, pickable: false, selectable: false, layerName: "Ruler",
                            isInDocumentBounds: false, isAnimated: false
                        },
                        GO(go.Shape, { geometryString: "M0 0 H400" }),
                        GO(go.Shape, { geometryString: "M0 0 V3", interval: 1 }),
                        GO(go.Shape, { geometryString: "M0 0 V15", interval: 5 }),
                        GO(go.TextBlock,
                            {
                                font: "10px sans-serif",
                                interval: 5,
                                alignmentFocus: go.Spot.TopLeft,
                                segmentOffset: new go.Point(0, 7)
                            }
                        )
                    );

                var gradScaleVert =
                    GO(go.Node, "Graduated",
                        {
                            graduatedTickUnit: 10, pickable: false, selectable: false, layerName: "Ruler",
                            isInDocumentBounds: false, isAnimated: false
                        },
                        GO(go.Shape, { geometryString: "M0 0 V400" }),
                        GO(go.Shape, { geometryString: "M0 0 V3", interval: 1, alignmentFocus: go.Spot.Bottom }),
                        GO(go.Shape, { geometryString: "M0 0 V15", interval: 5, alignmentFocus: go.Spot.Bottom }),
                        GO(go.TextBlock,
                            {
                                font: "10px sans-serif",
                                segmentOrientation: go.Link.OrientOpposite,
                                interval: 5,
                                alignmentFocus: go.Spot.BottomLeft,
                                segmentOffset: new go.Point(0, -7)
                            }
                        )
                    );

                function setupScalesAndIndicators() {
                    diagram.startTransaction("add scales");
                    updateScales();
                    // Add each node to the diagram
                    diagram.add(gradScaleHoriz);
                    diagram.add(gradScaleVert);
                    diagram.commitTransaction("add scales");
                }

                function updateScales() {
                    var vb = diagram.viewportBounds;
                    diagram.startTransaction("update scales");
                    gradScaleHoriz.location = new go.Point(vb.x, vb.y);
                    gradScaleHoriz.graduatedMin = vb.x;
                    gradScaleHoriz.graduatedMax = vb.x + vb.width;
                    gradScaleHoriz.elt(0).width = vb.width;
                    gradScaleVert.location = new go.Point(vb.x, vb.y);
                    gradScaleVert.graduatedMin = vb.y;
                    gradScaleVert.graduatedMax = vb.y + vb.height;
                    gradScaleVert.elt(0).height = vb.height;
                    diagram.commitTransaction("update scales");
                }

                diagram.addDiagramListener("InitialLayoutCompleted", setupScalesAndIndicators);
                diagram.addDiagramListener("ViewportBoundsChanged", updateScales);

normal view

zoomed out image
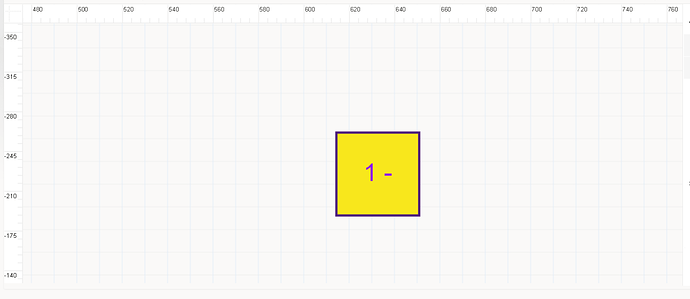
You have added the rulers to the Diagram itself, so when the Diagram.scale becomes smaller, the rulers appear smaller. However, the “ViewportBoundsChanged” DiagramEvent listener updates the rulers so that they are positioned at the top or left sides of the viewport with the appropriate length to occupy the whole side.

As the user zooms out it’s certainly the case that the distances appear smaller, so the ruler really has to have its tick marks be closer together. I hope that’s not what you are complaining about. More likely you are complaining that the text is getting smaller with the reduced scale. One possibility is to change the scale of the rulers and scale down the distance between the tick marks so that they continue to line up with the diagram’s grid.

Is that what you want? Or do you want something else? It’s good that you showed before-and-after screenshots, but you didn’t show a screenshot for what you wanted.

yes my problem is that the text is getting smaller with the reduced scale.
as the user zooms out, the texts become unreadable.
values ​​on ruler cannot be read

How can I solve this situation, can you show me on the code?

What’s wrong with the standard sample that we provide? Diagram with Rulers