Let’s try an easier way.
This is a simple example:
init();

function bindGeometry(geo){
 var icons={
	    andOperatorBorder: "M83.1997944,59.3306111 L51.8283778,59.3306111 L51.8283778,54.2987361 L83.1997944,54.2987361 L83.1997944,42.0538333 L88.2316694,42.0538333 L88.2316694,89.515125 C88.2316694,92.2075373 85.9797239,94.3280764 83.2759125,94.3280764 L51.8290514,94.3280764 L51.8290514,89.2962014 L83.1997944,89.2962014 L83.1997944,59.3306111 Z",
    andOperatorMain: "M102.067238,17.0324139 L86.6886978,17.0324139 L82.5390392,20.8112985 C81.7172999,21.5552216 80.640173,21.9645944 79.5275361,21.9645944 L69.3647653,21.9645944 L69.3647653,40.2141885 L102.067238,40.2206812 L102.067238,17.0324139 Z M83.4709164,13.157027 C84.2920687,12.4108087 85.3707466,12.0005389 86.4845917,12.0005389 L102.67955,12.0005389 C105.087171,12.0005389 107.099113,13.893495 107.099113,16.3082819 L107.099113,40.9449347 C107.099113,43.3597217 105.087171,45.2526778 102.67955,45.2526778 L68.74788,45.2459396 C66.3419206,45.242855 64.3328903,43.3507888 64.3328903,40.9381986 L64.3328903,21.2404625 C64.3328903,18.8272117 66.3434522,16.9327194 68.7511056,16.9327194 L79.3247767,16.9327194 L83.4709164,13.157027 Z M48.7346167,43.4383736 L33.356077,43.4383736 L29.2064184,47.2172582 C28.3846791,47.9611813 27.3075521,48.3705542 26.1949153,48.3705542 L16.0321444,48.3705542 L16.0321444,66.6201482 L48.7346167,66.6266409 L48.7346167,43.4383736 Z M25.9921558,43.3386792 L30.1382955,39.5629867 C30.9594479,38.8167684 32.0381257,38.4064986 33.1519708,38.4064986 L49.3469292,38.4064986 C51.7545498,38.4064986 53.7664917,40.2994547 53.7664917,42.7142417 L53.7664917,67.3508944 C53.7664917,69.7656814 51.7545498,71.6586375 49.3469292,71.6586375 L15.4152592,71.6518993 C13.0092998,71.6488148 11.0002694,69.7567485 11.0002694,67.3441583 L11.0002694,47.6464222 C11.0002694,45.2331714 13.0108313,43.3386792 15.4184847,43.3386792 L25.9921558,43.3386792 Z M48.7346167,103.406212 L48.7346167,80.2179444 L33.356077,80.2179444 L29.2064184,83.9968291 C28.3846791,84.7407522 27.3075521,85.150125 26.1949153,85.150125 L16.0321444,85.150125 L16.0321444,103.399719 L48.7346167,103.406212 Z M30.1382955,76.3425575 C30.9594479,75.5963393 32.0381257,75.1860694 33.1519708,75.1860694 L49.3469292,75.1860694 C51.7545498,75.1860694 53.7664917,77.0790255 53.7664917,79.4938125 L53.7664917,104.130465 C53.7664917,106.545252 51.7545498,108.438208 49.3469292,108.438208 L15.4152592,108.43147 C13.0092998,108.428386 11.0002694,106.536319 11.0002694,104.123729 L11.0002694,84.4259931 C11.0002694,82.0127423 13.0108313,80.11825 15.4184847,80.11825 L25.9921558,80.11825 L30.1382955,76.3425575 Z",

}
	return go.Geometry.parse(icons[geo], true)
}
 function init() {
  if (window.goSamples) goSamples();  // init for these samples -- you don't need to call this
  var $ = go.GraphObject.make;

  myDiagram =
    $(go.Diagram, "myDiagramDiv",
      {
        initialContentAlignment: go.Spot.Center,
        "undoManager.isEnabled": true,

      });

  // A simple resizable node
  myDiagram.nodeTemplate =
    $(go.Node, "Auto",
    {
      selectable:true,
      resizable:true,

	    },
  $(go.Panel, "Position",
    new go.Binding("itemArray", "items"),
    {
      itemTemplate:
        $(go.Panel, "Auto",
          $(go.Shape, "RoundedRectangle",
            {
			        fill: "#91E3E0",
            isGeometryPositioned: true,
			        },
			        new go.Binding("geometry", "g",bindGeometry),
           // new go.Binding("fill", "c")),
        )
        )
    }
));
  myDiagram.model = $(go.GraphLinksModel,
  {
    nodeDataArray: [
      {
        key: 1,
        items: [
          { t: "", c: "orange",g:"andOperatorBorder" },
		         { t: "", c: "orange",g:"andOperatorMain" }
        ]
      },
    ],
    linkDataArray: [
    ]
  }
);
}
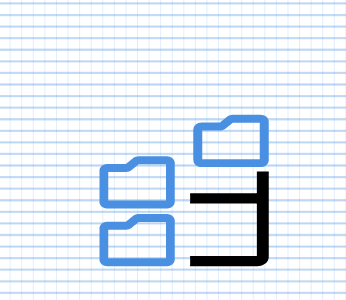
There is a method used to generate the shape inside.
how do i scaling of shapes when node resizing ?