Hi I am facing issues with links which are getting created between nodes.
I am trying to achieve below scenarios.
-
Pre-Drawn nodes between 2 existing “start” and “end” nodes.
-
There should be only 1 link drawn between 2 nodes.
-
One should be able to drag an existing link from one node to other.
-
The pre-drawn nodes link should not appear again once i delete it.
To achieve the above scenarios i did the below things
-
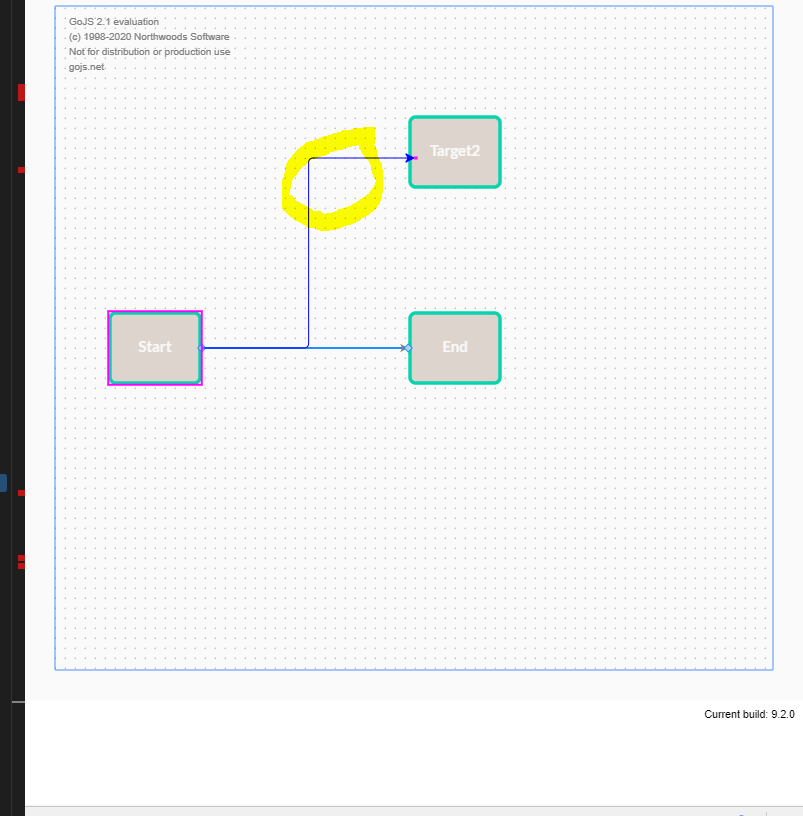
Added a default link data in linkArray.(It draws a default link between nodes). But if i delete the link and move the node around it again gets linked to the previous node.
-
Added toMaxLinks: 1,fromMaxLinks: 1, to my port but it is still not handling the scenario.
-
Added relinkableFrom: true, relinkableTo: true, in my linkTemplate. But this is not working as well.
-
Also the ‘undoManager.isEnabled’: true is not undoing the diagram actions.
My code is shared below in stackblitz:
Below is my code in text :
 public diagramNodeData: Array<go.ObjectData> = [
   { key: "Start", desc: "Start", color: "gray", category: "start", loc: "0 0" },
    { key: "End", desc: "End", color: "gray", category: "end", loc: "300 0" },
    { key: "Target", desc: "End", color: "gray", loc: "300 -300" },
     { key: "Target2", desc: "End", color: "gray", loc: "300 300" }
  ];
  public diagramLinkData: Array<go.ObjectData> = [
    {from:'Start', to: 'End'}
  ];


  public diagramModelData = { nodeDataArray: this.diagramNodeData,linkDataArray:this.diagramLinkData };

    // When the diagram model changes, update app data to reflect those changes
    public diagramModelChange = function (changes: go.IncrementalData) {
      this.diagramNodeData = DataSyncService.syncNodeData(changes, this.diagramNodeData);
      this.diagramLinkData = DataSyncService.syncLinkData(changes, this.diagramLinkData);
      this.diagramModelData = DataSyncService.syncModelData(changes, this.diagramModelData);
      };

  // initialize diagram / templates
  public initDiagram(): go.Diagram {

const $ = go.GraphObject.make;
const dia = $(go.Diagram,
  {
    'grid.visible': true,
    'undoManager.isEnabled': true,
    "LinkDrawn": showLinkLabel,  // this DiagramEvent listener is defined below
    "LinkRelinked": showLinkLabel,
    allowRelink: true,
    allowCopy: true,
    allowDelete: true,
    allowMove: true,
    allowUndo: true,
    model: $(go.GraphLinksModel,
      {
        linkKeyProperty: 'key' // IMPORTANT! must be defined for merges and data sync when using GraphLinksModel
      })
  }
);
// Make link labels visible if coming out of a "conditional" node.
// This listener is called by the "LinkDrawn" and "LinkRelinked" DiagramEvents.
function showLinkLabel(e) {
  var label = e.subject.findObject("LABEL");
  if (label !== null) label.visible = (e.subject.fromNode.data.category === "Conditional");
}

//Define the diagram grid
dia.grid =
  $(go.Panel, go.Panel.Grid,  // or "Grid"
    { gridCellSize: new go.Size(10, 10) },
    $(go.Shape, "LineH", { strokeDashArray: [0.5, 9.5], strokeWidth: 0.5 }),
    $(go.Shape, "LineV", { strokeDashArray: [0.5, 9.5], strokeWidth: 0.5 })
  );
//Add Scroll Margin to add scroll in Diagram
dia.scrollMargin = 100;


//Define the link template for the link properties
dia.linkTemplate =
$(go.Link,  // the whole link panel
  {
    routing: go.Link.AvoidsNodes,
    curve: go.Link.JumpOver,
    corner: 5, toShortLength: 4,
    relinkableFrom: true,
    relinkableTo: true,
    reshapable: false,
    resegmentable: true,
    resizable: true,
    canRelinkTo: function(){return true;},
    // mouse-overs subtly highlight links:
    mouseEnter: function (e, link: any) { link.findObject("HIGHLIGHT").stroke = "rgba(30,144,255,0.2)"; },
    mouseLeave: function (e, link: any) { link.findObject("HIGHLIGHT").stroke = "transparent"; },
    selectionAdorned: false
  },
  new go.Binding("points").makeTwoWay(),
  $(go.Shape,  // the highlight shape, normally transparent
    { isPanelMain: true, strokeWidth: 8, stroke: "transparent", name: "HIGHLIGHT" }),
  $(go.Shape,  // the link path shape
    { isPanelMain: true, stroke: "gray", strokeWidth: 2 },
    new go.Binding("stroke", "isSelected", function (sel) { return sel ? "dodgerblue" : "gray"; }).ofObject()),
  $(go.Shape,  // the arrowhead
    { toArrow: "standard", strokeWidth: 0, fill: "gray" }),
  $(go.Panel, "Auto",  // the link label, normally not visible
    { visible: false, name: "LABEL", segmentIndex: 2, segmentFraction: 0.5 },
    new go.Binding("visible", "visible").makeTwoWay(),
    $(go.Shape, "RoundedRectangle",  // the label shape
      { fill: "#F8F8F8", strokeWidth: 0 }),
    $(go.TextBlock, "Yes",  // the label
      {
        textAlign: "center",
        font: "10pt helvetica, arial, sans-serif",
        stroke: "#333333",
        editable: true
      },
      new go.Binding("text").makeTwoWay())
  )
);
  // temporary links used by LinkingTool and RelinkingTool are also orthogonal:
 dia.toolManager.linkingTool.temporaryLink.routing = go.Link.Orthogonal;
 dia.toolManager.relinkingTool.temporaryLink.routing = go.Link.Orthogonal;

var templmap = new go.Map<string, go.Part>(); // In TypeScript you could write: new go.Map<string, go.Node>();
// for each of the node categories, specify which template to use

//Start Node
var startTemplate =
  $(go.Node, "Table", nodeStyle(),
    $(go.Panel, "Spot",
      $(go.Shape, "RoundedRectangle",
        { desiredSize: new go.Size(90, 70), fill: "#dcd4cd", stroke: "#09d3ac", strokeWidth: 3.5 }),
      $(go.TextBlock, "Start", textStyle(),
        new go.Binding("text", "key")),
    ),
    new go.Binding("location", "loc"),
    // two named ports, one on right and one on bottom all outgoing:

    makePort("R", go.Spot.Right, go.Spot.Right, true, true),
    makePort("B", go.Spot.Bottom, go.Spot.Bottom, true, true)
  );
// End Node Template
var endTemplate =
  $(go.Node, "Table", nodeStyle(),
    $(go.Panel, "Spot",
      $(go.Shape, "RoundedRectangle",
        { desiredSize: new go.Size(90, 70), fill: "#dcd4cd", stroke: "#09d3ac", strokeWidth: 3.5 }),
      $(go.TextBlock, "End", textStyle(),
        new go.Binding("text", "key"),

        ),

    ),
    new go.Binding("location", "loc"),
    // one named ports, on left incoming only:
    makePort("L", go.Spot.Left, go.Spot.Left, false, true),
  );

//Define the Style of the Text
function textStyle() {
  return {
    font: "bold 11pt Lato, Helvetica, Arial, sans-serif",
    stroke: "#F8F8F8",
    wrap: go.TextBlock.WrapFit,
    maxSize: new go.Size(80, NaN)


  }
}

// Define a function for creating a "port" that is normally transparent.
// The "name" is used as the GraphObject.portId,
// the "align" is used to determine where to position the port relative to the body of the node,
// the "spot" is used to control how links connect with the port and whether the port
// stretches along the side of the node,
// and the boolean "output" and "input" arguments control whether the user can draw links from or to the port.
function makePort(name, align, spot, output, input) {
  var horizontal = align.equals(go.Spot.Top) || align.equals(go.Spot.Bottom);
  // the port is basically just a transparent rectangle that stretches along the side of the node,
  // and becomes colored when the mouse passes over it
  return $(go.Shape,
    {
      fill: "transparent",  // changed to a color in the mouseEnter event handler
      strokeWidth: 0,  // no stroke
      width: horizontal ? NaN : 8,  // if not stretching horizontally, just 8 wide
      height: !horizontal ? NaN : 8,  // if not stretching vertically, just 8 tall
      alignment: align,  // align the port on the main Shape
      stretch: (horizontal ? go.GraphObject.Horizontal : go.GraphObject.Vertical),
      portId: name,  // declare this object to be a "port"
      fromSpot: spot,  // declare where links may connect at this port
      fromLinkable: output,  // declare whether the user may draw links from here
      toSpot: spot,  // declare where links may connect at this port
      toLinkable: input,  // declare whether the user may draw links to here
      cursor: "pointer",  // show a different cursor to indicate potential link point
      toMaxLinks: 1, //Gets or sets the maximum number of links that may go into this port
      fromMaxLinks: 1, //Gets or sets the maximum number of links that may come out of this port.

      mouseEnter: function (e, port) {  // the PORT argument will be this Shape
        if (!e.diagram.isReadOnly) port.fill = "rgba(255,0,255,0.5)";
      },
      mouseLeave: function (e, port) {
        port.fill = "transparent";
      }
    });
 }

templmap.add("start", startTemplate);
templmap.add("end", endTemplate);
dia.nodeTemplateMap = templmap;
// define the Node template
dia.nodeTemplate =
$(go.Node, "Table", nodeStyle(),
$(go.Panel, "Spot",
  $(go.Shape, "RoundedRectangle",
    { desiredSize: new go.Size(90, 70), fill: "#dcd4cd", stroke: "#09d3ac", strokeWidth: 3.5 }),
  $(go.TextBlock, "End", textStyle(),
    new go.Binding("text", "key")),
),
new go.Binding("location", "loc"),
// Two named ports, on left incoming only
makePort("L", go.Spot.Left, go.Spot.Left, true, true),
makePort("R", go.Spot.Right, go.Spot.Right, true, true),
);

templmap.add("start", startTemplate);
templmap.add("end", endTemplate);
// for the default category, "", use the same template that Diagrams use by default;
// this just shows the key value as a simple TextBlock
templmap.add("", dia.nodeTemplate);

dia.nodeTemplateMap = templmap;

function nodeStyle() {
  return [
    // The Node.location comes from the "loc" property of the node data,
    // converted by the Point.parse static method.
    // If the Node.location is changed, it updates the "loc" property of the node data,
    // converting back using the Point.stringify static method.
    new go.Binding("location", "loc", go.Point.parse).makeTwoWay(go.Point.stringify),
    {
      // the Node.location is at the center of each node
      locationSpot: go.Spot.Center
    }
  ];
}

   return dia;
  }
}