Seeking Guidance on Optimizing Large Diagrams in GoJS

Dear GoJS community,

I’m currently maintaining an application with GoJS where we deal with large diagrams (approximately more than 17,000 nodes and 11,000 connections). As the size of our diagrams increases, we’ve noticed a significant slowdown in rendering.

So far, we’ve explored several approaches to mitigate this issue:

  1. Virtualization: We’ve considered using virtualization to load only the nodes visible in the viewport. However, as we understand it, virtualization requires setting the position of each node manually, which is far from ideal given the three out-of-the-box layouts (TreeLayout, LayeredDigraphLayout, and ForceDirectedLayout) we are currently using. We’d prefer to avoid such a large-scale modification unless there’s no other solution.
  2. Pagination: We’ve experimented with pagination, but it results in a subpar user experience. Our nodes are not strictly hierarchical, resulting in peculiar connections between nodes that are far apart. Additionally, even if we ordered the nodes, the experience of loading the diagram in chunks is disruptive to the user.
  3. Server-side rendering: We also evaluated the possibility of server-side rendering. But as per our understanding, this would generate a static image that the user can’t interact with or move around. This again is not ideal for our user experience.

We are wondering if there are any other strategies we haven’t yet considered or if there are any potential optimizations that might make our current layouts more performant.

We are aware that GoJS has some built-in capabilities for dealing with large diagrams, and we’re wondering if there’s a way to leverage these without completely restructuring our layouts or sacrificing interactivity.

Thank you in advance for your advice and guidance.

Best regards

Precisely when is the problem slowdown happening? Only when loading the diagram? Or when scrolling or zooming or dragging around a node?

And what percentage of the graph should be visible in the viewport initially or when scrolling/zooming/dragging/etc?

Hello Walter,

Appreciate your prompt response.

To clarify, the issue presents itself during the initial loading of the diagram. Regarding the percentage, we don’t require a set percentage. Our viewport is responsively designed with a 16:9 aspect ratio and we utilize a scale of 0.5. Consequently, for smaller diagrams, they fit completely within the viewport (100% visibility), while larger diagrams may occupy a varying percentage of the viewport based on their size.

Additionally, we provide our users with the capability to adjust the scale through the user interface.

Something that I forgot to mention, to try and address this issue, we have attempted the strategy detailed in this post: Using gojs in node to render large layouts on the server side. However, the improvements were marginal at best (time reduced from 46 to 36 seconds in Node.js), hence we are still looking for a more efficient solution.

Thank you,

OK, so drawing time isn’t an issue (i.e. scrolling or zooming).

Yes, that’s implying that the layout time was not a significant percentage of the delay – it was the time to actually create all of those Nodes and Links, including time to evaluate all of the Bindings and then do panel layouts.

Have you read GoJS Performance Considerations -- Northwoods Software ? Since you haven’t provided any information about what it is that you are displaying, it’s hard for me to guess what might be useful.

If you have long orthogonal links that either have AvoidsNodes routing or that JumpOver or JumpGap, finding all of the intersections and computing all of those geometries can be significant. Perhaps those could be delayed – particularly the JumpOver or JumpGap computations.

Apologies for the delay in my response.

We have implemented some of your recommended approach in our diagram visualization, incorporating the following strategies:

  1. Virtualization: To handle the rendering of large diagrams more efficiently, we’ve implemented virtualization. This helps prevent performance issues when panning or navigating around the diagram after the initial load.
  2. Zoom Logic with Grouping: We have introduced a zoom logic that dynamically adjusts the level of detail displayed based on the zoom level. This involves grouping nodes based on specific business logic. When zoomed out, fewer details are shown, and as the user zooms in, more detailed nodes are displayed.

We’ve drawn inspiration from two samples provided by GoJS, which can be switched between according to user preferences:

However, we are encountering an issue specifically with the ForcedDirectedLayout. While the diagram model does contain groups as evident from the diagram.model.nodeDataArray, these groups aren’t visible on the canvas when initially loaded into the ForcedDirectedLayout.

For instance, executing the following code snippet in the console shows the presence of five groups that are not being displayed:

const diagram = document.getElementById('diagramRoot').goDiagram;
diagram.model.nodeDataArray.filter(node => node.isGroup)

Here is the code we utilize to expand all groups when clicked, which results in the rendering of the missing groups:

diagram?.commit((d) => {
  d.findTopLevelGroups().each((topLevelGroup) => {
    // Expand the top-level group and its children
    topLevelGroup.isSubGraphExpanded = true;
    // Iterate through and expand all nested groups
    topLevelGroup.findSubGraphParts().each((secondLevelPart) => {
      if (secondLevelPart?.data?.isGroup) {
        const secondLevelGroup = secondLevelPart?.part as Group;
        secondLevelGroup.expandSubGraph();
      }
    });
  });
});

This issue seems to be isolated to the ForcedDirectedLayout, as the TreeLayout works as expected without any issues.

We appreciate any insights or assistance you can provide to help us resolve this discrepancy and ensure consistent behavior across both layouts. Thank you in advance for your support.

That’s odd. What is the group template? (Or templates, if there’s more than one.)

Do you have a relevant screenshot that you can share with us?

Hey Walter, thanks for your response

So you gave us a nice clue with your answer :).

In our DefaultGroup template, if we comment out the isSubGraphExpanded:false in the initial properties, then the diagram works perfectly.

Do you have any insights into what could be causing the issue?

Here is the whole template:


export const DefaultGroup = () => {
  return GO_DIAGRAM(
    go.Group,
    "Auto",
    {
      layout: GO_DIAGRAM(go.TreeLayout, {
        angle: 90,
        arrangement: go.TreeLayout.ArrangementHorizontal,
        setsPortSpot: false,
        setsChildPortSpot: false,
        arrangementSpacing: new go.Size(60, 60), // horizontal spacing
        layerSpacing: 75, // vertical spacing
      }),
      isAnimated: true,
      shadowColor: GROUP_SHADOW_COLOR,
      shadowBlur: 0,
      // if we comment the next line out, it works
      // isSubGraphExpanded: false,
      selectionAdorned: false,
      // When group is selected move to forground AND its children
      ...groupEventHandlers(),
    },
    new go.Binding("visible", "isHidden", (isHidden) => !isHidden),
    new go.Binding(
      "isShadowed",
      "",
      (group) => !group.isSubGraphExpanded
    ).ofObject(),
    GO_DIAGRAM(
      go.Shape,
      // surrounds everything
      "RoundedRectangle",
      {
        parameter1: 5,
        name: NODE_BODY_SHAPE,
        spot1: go.Spot.TopLeft,
        spot2: go.Spot.BottomRight,
        strokeWidth: 1,
      },
      new go.Binding("stroke", "", bindSelectColor).ofObject(),
      new go.Binding("strokeWidth", "", bindNodeStrokeWidth).ofObject(),
      new go.Binding("fill", "", (node: go.Node) => {
        const lvl = node.findSubGraphLevel();
        return lvl % 2 ? GROUP_SECONDARY_COLOR : WHITE_COLOR;
      }).ofObject()
    ),
    GO_DIAGRAM(
      go.Panel,
      "Vertical",
      GO_DIAGRAM(
        go.Panel,
        // Position header above the subgraph
        "Table",
        {
          margin: 6,
        },
        new go.Binding("width", "", (group) =>
          group.isSubGraphExpanded ? NaN : 150
        ).ofObject(),

        ExpandButton().set({ column: 0, row: 0, margin: ROW_ITEM_GAP("left") }),

        withExpandedProperties(
          GO_DIAGRAM(
            go.Picture,
            {
              row: 0,
              column: 1,
              alignment: go.Spot.Center,
            },
            new go.Binding("source", "source", convertKeyImage)
          ),
          {
            desiredSize: [new go.Size(16, 16), new go.Size(40, 40)],
            margin: [
              ROW_ITEM_GAP(),
              new go.Margin(15, undefined, 15, undefined),
            ],
          }
        ),
        withExpandedProperties(
          AssetActionsButton().set({ row: 0, margin: ROW_ITEM_GAP("right") }),
          {
            alignment: [go.Spot.RightCenter, go.Spot.TopRight],
            column: [7, 2],
          }
        ),

        withExpandedProperties(GroupTitle(), {
          row: [0, 1],
          column: [2, 0],
          columnSpan: [1, 3],
          width: [NaN, TITLE_WIDTH],
          margin: [ROW_ITEM_GAP(), new go.Margin(0, 0, 10, 0)],
        }),

        GO_DIAGRAM(
          go.TextBlock,
          {
            text: "|",
            width: 2,
            stroke: ASSET_BORDER_COLOR,
            row: 0,
            font: "24px",
            column: 3,
            margin: ROW_ITEM_GAP(),
          },
          new go.Binding("visible", "isSubGraphExpanded").ofObject()
        ),

        withExpandedProperties(AssetSubtitle(), {
          row: [0, 2],
          column: [4, 0],
          columnSpan: [1, 3],
          width: [NaN, SUBTITLE_WIDTH],
          margin: [ROW_ITEM_GAP(), new go.Margin(0, 0, 10, 0)],
          alignment: [go.Spot.LeftCenter, go.Spot.Center],
        }),

        withExpandedProperties(NetworkTopologyAssetIP(), {
          row: [0, 3],
          column: [5, 0],
          columnSpan: [1, 3],
          spacingAbove: [9, 0],
          spacingBelow: [8, 0],
          width: [NaN, SUBTITLE_WIDTH],
          margin: [ROW_ITEM_GAP(), new go.Margin(0, 0, 10, 0)],
          alignment: [go.Spot.LeftCenter, go.Spot.Center],
        }),

        withExpandedProperties(
          GO_DIAGRAM(
            go.Panel,
            "Auto",
            GO_DIAGRAM(go.Shape, "Badge", {
              fill: BADGE_COLOR,
              stroke: null,
              height: 24,
              parameter1: 12,
              minSize: new go.Size(24, 24),
            }),
            GO_DIAGRAM(
              go.TextBlock,
              { stroke: BADGE_STROKE_COLOR, margin: 4 },
              new go.Binding("text", "", (node: go.Group) =>
                node
                  .findSubGraphParts()
                  .filter((a) => a instanceof go.Node && !a.data?.isHidden)
                  .count.toString()
              ).ofObject()
            )
          ),
          {
            row: [0, 4],
            column: [6, 0],
            columnSpan: [1, 3],
            alignment: [go.Spot.LeftCenter, go.Spot.Center],
          }
        ),
        withExpandedProperties(
          GO_DIAGRAM(
            // Represents area for all member parts
            go.Placeholder,
            {
              padding: 12,
              row: 6,
              column: 0,
            }
          ),
          {
            columnSpan: [7, 3],
            padding: [38, 0],
            alignment: [go.Spot.LeftCenter, go.Spot.Center],
          }
        )
      ),
      withExpandedProperties(
        GO_DIAGRAM(
          go.Panel,
          "Auto",
          {
            name: GROUP_TOOLBAR,
            stretch: go.GraphObject.Fill,
            margin: new go.Margin(10, 0, 0, 0),
          },
          new go.Binding("visible", "", shouldAssetDisplayToolbar),
          AssetToolBar(true),
          GO_DIAGRAM(
            go.Panel,
            "Horizontal",
            AssetInfoButton(),
            VmStatusButton(),
            UnscannedDevicesButton(),
            AssetIssueButton()
          )
        ),
        {
          alignment: [go.Spot.Bottom, go.Spot.Bottom],
        }
      )
    )
  );
};
This is getting too complicated for me to understand. What is withExpandedProperties?

Based on what I’ve understood, this method was designed to control how various graph objects are shown in the panel, based on the status of the group.

Here’s the code for the method:

export const withExpandedProperties = (
  graphObject: go.GraphObject,
  properties: { [property: string]: [expanded: unknown, collapsed: unknown] }
) => {
  for (const p in properties) {
    if (Object.prototype.hasOwnProperty.call(properties, p)) {
      const value = properties[p];
      graphObject.bind(
        new go.Binding(p, "", (group: go.Group) =>
          group.isSubGraphExpanded ? value[0] : value[1]
        ).ofObject()
      );
    }
  }
  return graphObject;
};

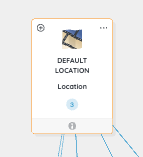
If we remove this function, the groups will appear this way:
image

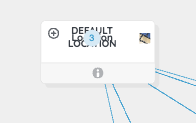
And if we add the function back, they will be like this:
image

OK. I think you could express that more concisely and efficiently as:

graphObject.bind(p, "isSubGraphExpanded", (exp: boolean) => exp ? value[0] : value[1]).ofObject()

So do you really want the groups to start off collapsed? Setting Group.isSubGraphExpanded to false in the template would make sense then.