That doesn’t look right. Did you first recompute the layout on the server while not using those Link template settings?
V3.0 beta is at GoJS: Build Interactive Diagrams for the Web. Or npm install gojs@beta
That doesn’t look right. Did you first recompute the layout on the server while not using those Link template settings?
V3.0 beta is at GoJS: Build Interactive Diagrams for the Web. Or npm install gojs@beta
const $ = go.GraphObject.make;
const diagram = $(go.Diagram);diagram.layout = $(go.ForceDirectedLayout, {
randomNumberGenerator: { random() { return 0.5 } },
maxIterations: 100,
defaultSpringLength: 150,
defaultElectricalCharge: 150
});
diagram.viewSize = new go.Size(400, 400);const NodeSize = new go.Size(120, 80);
diagram.nodeTemplate =
$(go.Node,
{ desiredSize: NodeSize, locationSpot: go.Spot.Center },
new go.Binding(“location”, “bounds”, b => go.Rect.parse(b).center)
.makeTwoWay(loc =>${Math.round(loc.x) - NodeSize.width / 2} ${Math.round(loc.y) - NodeSize.height / 2} ${NodeSize.width} ${NodeSize.height})
);
diagram.addDiagramListener(‘InitialLayoutCompleted’, function () {
console.log(JSON.stringify(diagram.model.toJson()));
});diagram.model = new go.GraphLinksModel(that.nodeDataArray);
This is the code I am using in the service file. Does anything look bad?
In the browser try not using a link template, or at least use one that doesn’t set the Link.routing property.
Also, regarding the code that you posted, I hope you are actually saving the model in your database somehow, to be delivered to the browser – not just printing it to the console.
It would be better if you set ForceDirectedLayout.randomNumberGenerator to null.
Yes I am saving the node’s bound and sending it to the browser with bounds.
In browser I am using the bounds. Are you saying, the bounds haven’t set?
I cannot tell since I haven’t seen the model data, but the uniform grid-like arrangement of the nodes is highly suspicious that something’s wrong.
In service,
new go.Binding(“location”, “bounds”, b => b.position)
.makeTwoWay((p, d) => new go.Rect(p.x, p.y, d.bounds.width, d.bounds.height)),
After getting it in browser (In string format Eg: “bounds”:“0 0 120 80”), I am parsing it and setting it in the nodeDataArray as Rect obj.
In browser,
new go.Binding(“location”, “bounds”, b => b.position)
.makeTwoWay((p, d) => new go.Rect(p.x, p.y, d.bounds.width, d.bounds.height)),
I still haven’t seen a glimpse of the actual model data that you are sending to the browser. Since your node location binding looks OK to me, it seems that the saved data isn’t right. Look at your data – do the node locations seem somewhat random?
Hello @walter
Its my bad.
I haven’t added linkDataArray for computing the locations in service file. Now working fine as expected.
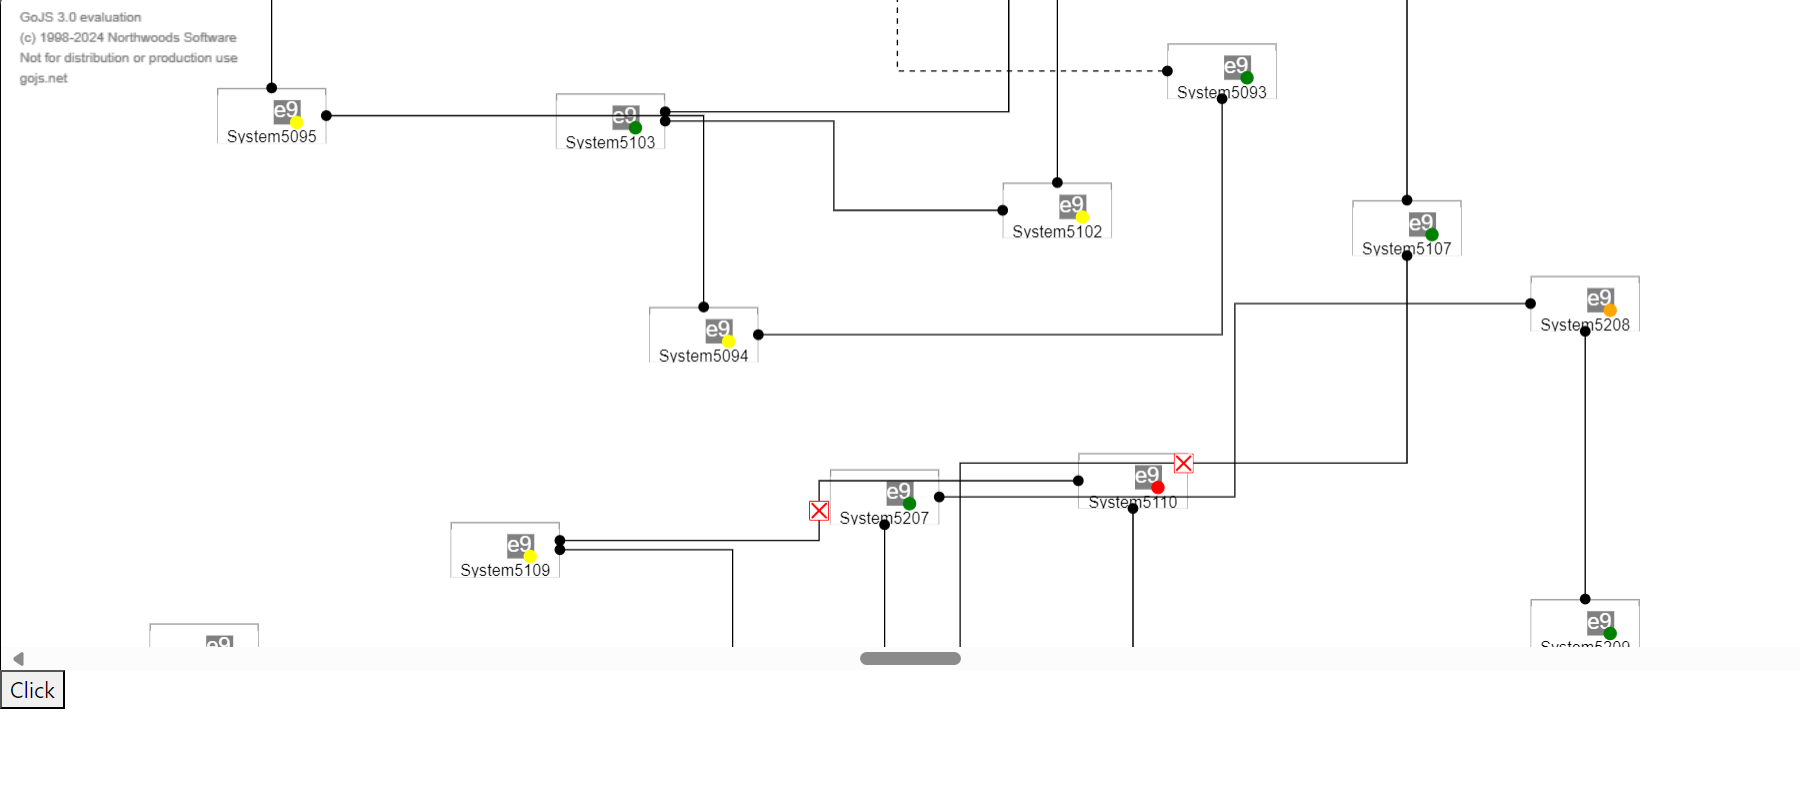
But even now, links overlapping nodes as shown below.
If you are precomputing layouts on the server, you probably don’t need virtualization until you get to mutiple tens of thousands of Nodes and Links. So I suggest just doing the normal implementation to see if virtualization is needed at all.
How is your Diagram defined?
This is how I define my diagram in the browser :
myDiagram =
new go.Diagram(“div”,
{
initialDocumentSpot: go.Spot.Center,
initialViewportSpot: go.Spot.Center,
“LayoutCompleted”: mergeLinksAtPorts,
“undoManager.isEnabled”: false,
“toolManager.hoverDelay”: 10,
layout: $(go.Layout, { isInitial: false, isOngoing: false }),
“animationManager.isEnabled”: false
});
myDiagram.nodeTemplate =
$(go.Node, “Auto”,
{
isLayoutPositioned: false,
locationSpot: go.Spot.Center,
background: “white”,
linkConnected: (node: any, link: any) => updateLinkWidths(link.fromNode, link.toNode),
linkDisconnected: (oldnode: any, link: any) => updateLinkWidths(link.fromNode, link.toNode, link)
},
new go.Binding(“position”, “bounds”, b => b.position)
.makeTwoWay((p, d) => new go.Rect(p.x, p.y, d.bounds.width, d.bounds.height)),
$(go.Shape, “Rectangle”,
{
fill: “white”, background: “white”, stroke: “black”, strokeWidth: 1, opacity: 0.4,
portId: “”,
fromSpot: go.Spot.AllSides, toSpot: go.Spot.AllSides,
},
new go.Binding(“width”, “”, (data) => { return (data?.portArray?.length * 5) > 80 ? data?.portArray?.length * 5 : 80 }),
new go.Binding(“height”, “”, (data) => { return (data?.portArray?.length * 2.5) > 40 ? data?.portArray?.length * 2.5 : 40 }),),
$(go.Panel, “Vertical”,
{ background: “white”, defaultAlignment: go.Spot.Center, margin: new go.Margin(10, 0, 0, 0) },
new go.Binding(“width”, “”, (data) => { return (data?.portArray?.length * 5) > 80 ? data?.portArray?.length * 5 : 80 }),
new go.Binding(“height”, “”, (data) => { return (data?.portArray?.length * 2.5) > 40 ? data?.portArray?.length * 2.5 : 40 }),
$(go.Panel, “Horizontal”,
{
defaultAlignment: go.Spot.Center
},
$(go.TextBlock, { font: “16px sans-serif”, margin: new go.Margin(0, 0, 0, 25), width: 20, height: 18, text: ‘e9’, stroke: “white”, background: ‘gray’ }),
$(go.Shape, “Circle”, { margin: new go.Margin(15, 0, 0, -8), width: 9, height: 9 },
new go.Binding(“stroke”, “topAlarmType”),
new go.Binding(“fill”, “topAlarmType”)),
),
$(go.TextBlock, { font: “12px sans-serif”, margin: new go.Margin(0, 0, 0, 0) },
new go.Binding(“text”, “labelname”)),),);
myDiagram.linkTemplate =
$(go.Link,
{
isLayoutPositioned: false,
routing: go.Link.Orthogonal,
},
$(go.Shape, “Rectangle”, { stroke: “black”, strokeWidth: 2 },
new go.Binding(‘strokeDashArray’, “”, (link) => {
if (link.lag) {
let dashLine = [4, 4]; // stroke width and height
return dashLine;
} else {
return ‘’;
}
})),
$(go.Panel, “Horizontal”,$(go.Panel, "Auto", $(go.Picture, { alignment: go.Spot.Center, desiredSize: new go.Size(15, 15), }, new go.Binding("source", "", (link) => { if (link.disconnected) { let pic = "../../assets/img/cross.png" return pic; } else { return '' } })), ), $(go.Panel, "Auto", { alignment: go.Spot.Center }, new go.Binding("visible", "", function (data) { if (data['showBubble']) { return true; } else { return false; } }), $(go.Shape, "Circle", { fill: "white", stroke: "gray" }), $(go.TextBlock, { alignment: go.Spot.Center, name: "TB" }) ), ), $(go.Shape, // the "from" arrowhead { figure: 'Circle', margin: 10, width: 7, height: 7, segmentIndex: 0, segmentOffset: new go.Point(0, 0), fill: "black", stroke: "black", toolTip: // define a tooltip for each node that displays the color as text $("ToolTip", $(go.TextBlock, { margin: 4 }, new go.Binding("text", "fromPort")) ) // end of Adornment }), $(go.Shape, // the "to" arrowhead { figure: 'Circle', width: 7, height: 7, segmentIndex: -1, segmentOffset: new go.Point(0, 0), fill: "black", stroke: "black", toolTip: // define a tooltip for each node that displays the color as text $("ToolTip", $(go.TextBlock, { margin: 4 }, new go.Binding("text", "toPort")) ) // end of Adornment }));
In service :
const $ = go.GraphObject.make;
const diagram = $(go.Diagram);
diagram.layout = $(go.ForceDirectedLayout, {
  randomNumberGenerator: null,
  maxIterations: 300,
  defaultSpringLength: 150,
  defaultElectricalCharge: 150
});
diagram.viewSize = new go.Size(400, 400);

const NodeSize = new go.Size(130, 90);

diagram.nodeTemplate =
  $(go.Node,
    { desiredSize: NodeSize, locationSpot: go.Spot.Center },
    new go.Binding("location", "bounds", b => go.Rect.parse(b).center)
      .makeTwoWay(loc => `${Math.round(loc.x) - NodeSize.width / 2} ${Math.round(loc.y) - NodeSize.height / 2} ${NodeSize.width} ${NodeSize.height}`)
  );
let that = this;
diagram.addDiagramListener('InitialLayoutCompleted', function () {
  console.log(JSON.stringify(diagram.model.nodeDataArray));
  that.notifyComponent.next(JSON.stringify({ nodeDataArray: diagram.model.nodeDataArray, linkDataArray: that.linkDataArray, treeNodeDataArray : that.treeNodeDataArray }));
});


diagram.model = new go.GraphLinksModel(that.nodeDataArray, that.linkDataArray);
Example model : {
nodeDataArray : [
{
“key”: 0,
“name”: “e9”,
“labelname”: “System1”,
“systemName”: “AXOS”,
“color”: “#F0F0F0”,
“portArray”: [
{
“portId”: 0
},
{
“portId”: 1
}
]
},
{
“key”: 1,
“name”: “e9”,
“labelname”: “System2”,
“systemName”: “AXOS”,
“color”: “#F0F0F0”,
“portArray”: [
{
“portId”: 0
},
{
“portId”: 1
}
]
}
],
linkDataArray : [
{
“from”: 0,
“to”: 1,
“fromPort”: 1,
“toPort”: 0,
“disconnected”: false,
“vlanType”: “vlan3”,
“lag”: false
},
{
“from”: 1,
“to”: 0,
“fromPort”: 0,
“toPort”: 1,
“disconnected”: false,
“vlanType”: “vlan2”,
“lag”: false
}
]
}
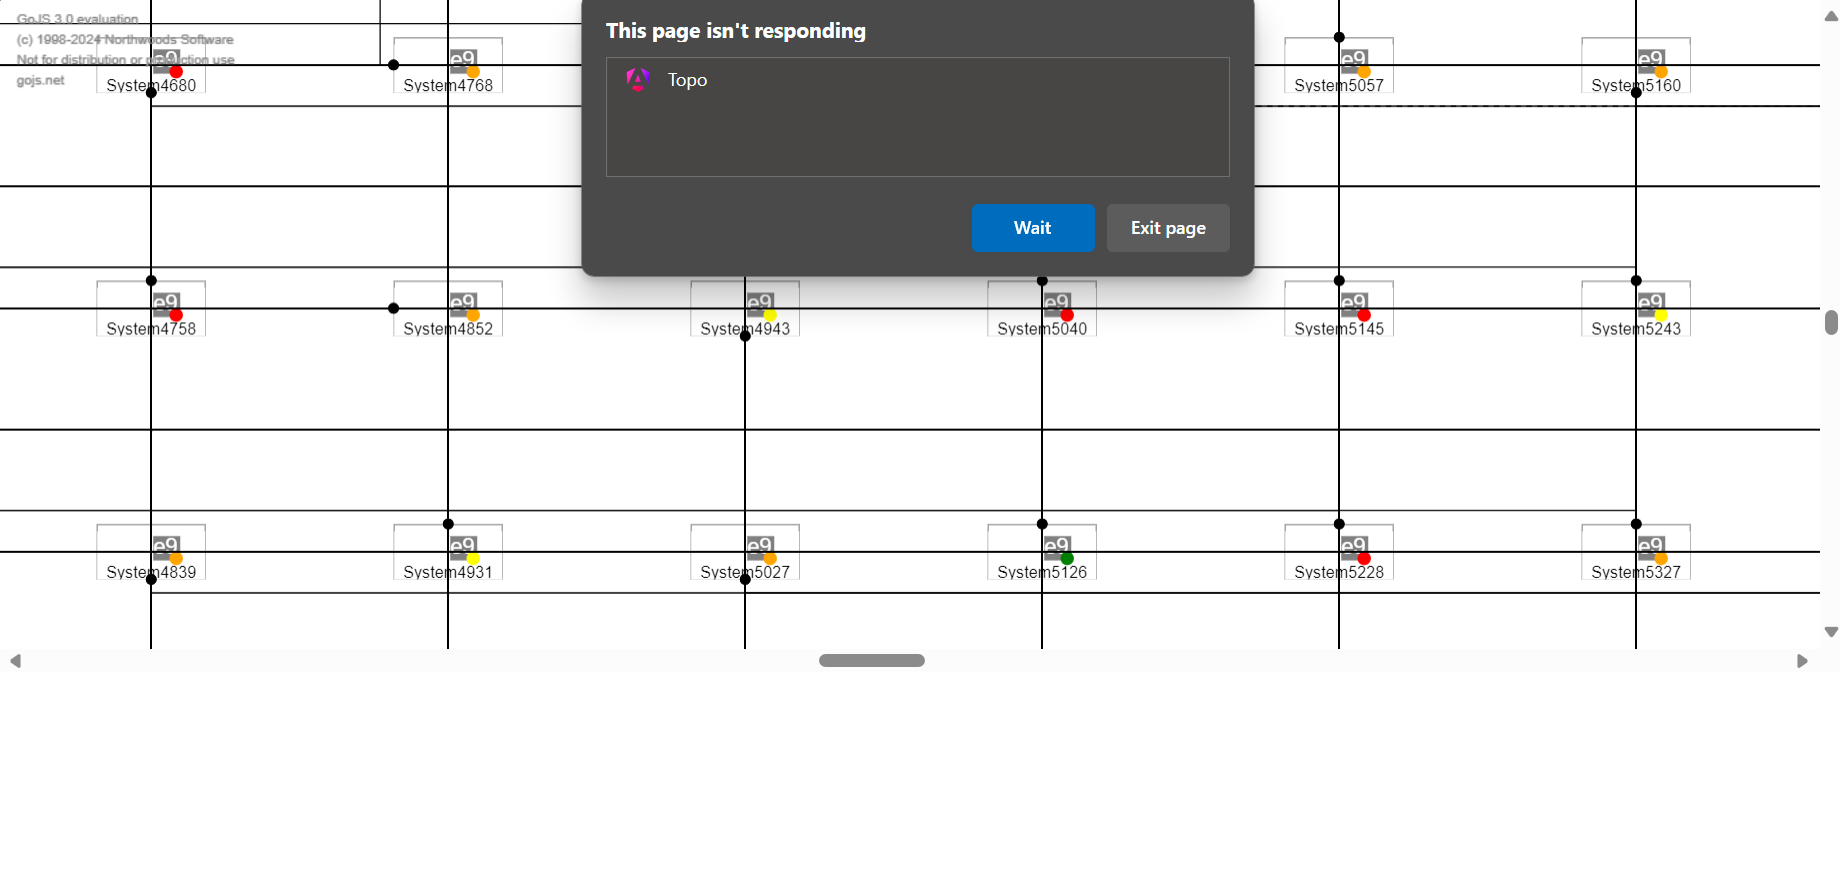
As you said I removed the virtualization. Same issue got (Page went unresponsive for 10k records)
I don’t understand why the browser should be taking much time if it is not doing any layout.
Here’s what I’ve been trying.
First, on the server:
import fs from "fs";
import go from "gojs";

const Before = Date.now();

const myDiagram =
  new go.Diagram("",  // no DOM, so there can be no DIV
    {
      viewSize: new go.Size(400, 400),  // no DIV, so provide viewport size
      layout: new go.ForceDirectedLayout({ maxIterations: 1 }),
      "InitialLayoutCompleted": e => {
        console.log((Date.now() - Before)/1000, "seconds");
        fs.writeFile("bigFDL.gojs", myDiagram.model.toJson(),
                     err => !err || console.log(err.toString()));
      }
    });

const NodeSize = new go.Size(150, 100);

myDiagram.nodeTemplate =
  new go.Node({ desiredSize: NodeSize, locationSpot: go.Spot.Center })
    .bind/*TwoWay*/("location", "bounds", b => go.Rect.parse(b).center,
                loc => `${Math.round(loc.x) - NodeSize.width/2} ${Math.round(loc.y) - NodeSize.height/2} ${NodeSize.width} ${NodeSize.height}`);

const NumNodes = 10000;

const nda = [];
const lda = [];
for (let i = 0; i < NumNodes; i++) {
  nda.push({ key: i, color: go.Brush.randomColor() });
  let t = i;
  while (t === i) t = Math.floor(Math.random() * NumNodes);
  lda.push({ from: i, to: Math.floor(Math.random() * NumNodes)})
}
myDiagram.model = new go.GraphLinksModel(nda, lda);
Note that for expediency I am saving the model with node location information as a JSON-formatted text file named “bigFDL.gojs”. Presumably you will be saving the big string in a database of some sort associated with the graph/diagram, to be sent to the browser when requested.
Note that I have set ForceDirectedLayout.maxIterations to 1 just to see how much time can be saved without compromising the results. You’ll need to experiment with this, but the results will be changing with future 3.0 beta releases.
Here’s the complete definition of the HTML page that can load that “.gojs” JSON file:
<!DOCTYPE html>
<html>
<head>
  <title>Loading a large model from a file</title>
  <!-- Copyright 1998-2024 by Northwoods Software Corporation. -->
  <meta name="viewport" content="width=device-width, initial-scale=1, user-scalable=no">
  <style>
    html {
      height: 100%;
    }
    body {
      width: 100%;
      height: 100%;
      min-height: 100%;
      margin: 0px;
      font-family: sans-serif;
      display: flex;
      flex-direction: column;
    }
  </style></head>
<body>
  <div style="margin: 10px 10px 0px 10px;">
    <input id="myFileInput" type="file" style="display:none">
    <button id="myFileOpenButton" title="Load a .GOJS file">Open File</button>
    <span id="myFilename" style="font: bold 11pt sans-serif"></span>
  </div>
  <div style="width: 100%; height: 100%; display: flex">
    <div id="myDiagramDiv" style="flex-grow: 1; margin: 10px; border: solid 1px black;"></div>
  </div>

  <script src="https://unpkg.com/gojs@beta"></script>
  <script id="code">
const $ = go.GraphObject.make;

const myDiagram =
  new go.Diagram("myDiagramDiv",
    {
      initialDocumentSpot: go.Spot.Center,
      initialViewportSpot: go.Spot.Center,
      "animationManager.isEnabled": false,
      "undoManager.isEnabled": true
    });

myDiagram.nodeTemplate =
  new go.Node("Auto", { width: 150, height: 120 })
    .bind/*TwoWay*/("location", "bounds", b => go.Rect.parse(b).center,
                loc => `${Math.round(loc.x) - NodeSize.width/2} ${Math.round(loc.y) - NodeSize.height/2} ${NodeSize.width} ${NodeSize.height}`)
    .add(
      new go.Shape({ fill: "white" })
        .bind("fill", "color"),
      new go.TextBlock()
        .bind("text", "color")
    );

// implement File Open button
document.getElementById("myFileOpenButton").addEventListener("click", () => document.getElementById("myFileInput").click());
document.getElementById("myFileInput").addEventListener("change", e => loadFiles(e.target.files), false);

// implement drag-and-drop of JSON file
function preventPropagation(e) {
  e.stopPropagation();
  e.preventDefault();
}
document.body.addEventListener("dragenter", preventPropagation);
document.body.addEventListener("dragover", preventPropagation);
document.body.addEventListener("drop", e => {
  preventPropagation(e);
  loadFiles(e.dataTransfer.files);
}, false);

// common code for opening file
function loadFiles(files) {
  try {
    for (let i = 0; i < files.length; i++) {
      const file = files[i];
      if (!file.name.toLowerCase().endsWith(".gojs")) continue;
      const reader = new FileReader();
      reader.onload = e => {
        document.getElementById("myFilename").textContent = file.name;
        myDiagram.model = go.Model.fromJson(e.target.result);
      };
      reader.readAsText(file);
      break;
    }
  } catch (ex) {
    console.log(ex.toString());
  }
}
</script>
</body>
</html>
Note that the file is loaded either by clicking on the “Open File” button or by drag-and-dropping the file onto the page.
And note that this diagram does not implement virtualization. Still, loading the “.gojs” file with 10000 nodes and 10000 links only takes a couple seconds. The file is a bit under 1MB in size.
The results of the ForceDirectedLayout are not as good as they will be – we are improving it during this 3.0 beta period. Both the server code and the browser code will work in 2.3 latest as well.