I have an issue with the way a graph displays itself after a layout change.
I allow the user to change the layout style of an existing graph. Once the new layout is applied, the resulting graph does not fill the viewport very well (it may group itself into a corner, or display itself with a height / width ratio that is nothing like the viewport.
As an example, if a graph has many nodes, and a circle layout is used, I can see the circle layout nicely in the viewport (much like doing a zoomToFit). If I then change the layout to something like a ForceDirected, Tree or LayeredDigraph, the resulting graph does not fit well in the viewport - its width / height ratio seems to be very different to the actual viewport, and seems to have been influenced by the calculated size of the previous Circle layout.
What I would like is for each layout change to result in a graph displayed as though it had been a new graph that had been loaded with all nodes and links - the graph being compact and fitted nicely to the viewport.
That is mostly working as I would like. I have been through a variety of scenarios since you helped me with creating a stable force directed graph a few weeks ago (the stable graph would leave nodes in their existing position when appending to the graph), so happy to get back to something simple.
There is one outstanding issue that I don’t understand. When I perform the layout change, the general shape of the graph is now correct, but the actual bounding box that presumably surrounds the nodes does not get centred in the viewport until I click the graph to reset the focus (the user changes layout by selecting from a set of buttons that are not part of the graph itself). For one of the layout type choices (LayeredDigraph), the graph itself is not visible until I click the graph, for all others, the graph is visible, but alignment is not centred (with the exception of the Grid layout which is fine).
ps: trying to set the focus in code does not seem to help
myDiagram.focus();
myDiagram.zoomToFit();
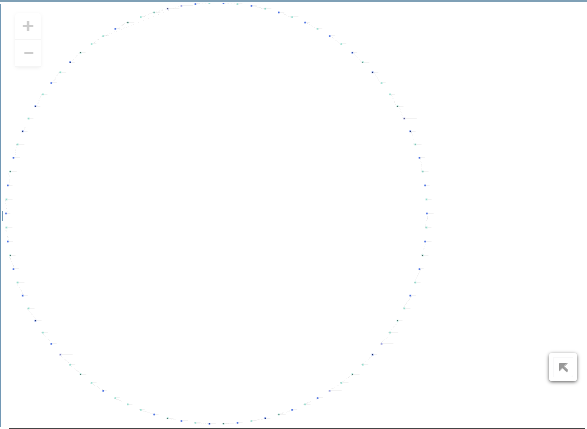
The images below show the result of changing to a circle layout (nicely sized, but offset)
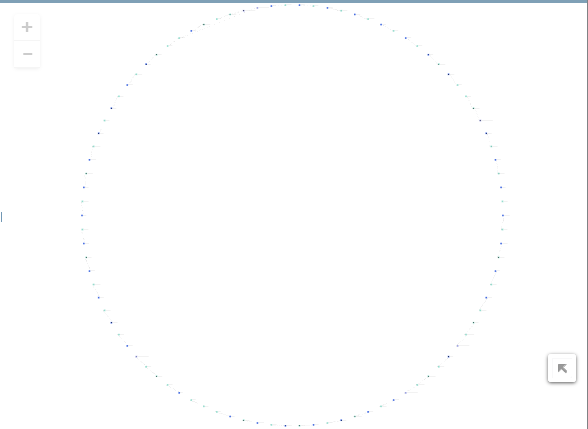
with this image showing once I set focus back to the graph (I presume it is the focus causing this change)
the layout change was within a transaction, but I have just checked and the zoomToFit() call was not.
var setLayout = function (layout) {
    document.body.style.cursor = 'wait';
    myDiagram.startTransaction("layoutChangeApplied");
    myDiagram.removeDiagramListener("LayoutCompleted", postLayoutChangeZoomToFit);
    myDiagram.addDiagramListener("LayoutCompleted", postLayoutChangeZoomToFit);
    myDiagram.layout = layout;

    myDiagram.commitTransaction("layoutChangeApplied");
};

var postLayoutChangeZoomToFit = function () {
    zoomToFit();
    document.body.style.cursor = 'default';
};
The creation of the new layout (that is passed to the setLayout function) is not in a transaction either, but I had assumed that is okay as it is not yet attached to the graph.
You are right that constructing a Layout need not be within a transaction, but modifying Diagram.layout (or Group.layout) should be.
Any “LayoutCompleted” DiagramEvent listener is executed within the transaction that is performing the layout.
However I do not understand why you are removing and then adding the same listener. That seems like it should be a no-op. I suggest that you establish the listener when you initialize the Diagram – you do not need to re-establish it each time you change the Diagram.layout.
The general shape of the graph layouts is now okay, but there is still the issue where what I presume is the bounding box that surrounds all of the graph nodes is not aligned in the centre of the graph (as per the screenshots), or, for a couple of the layouts, when I change to the new layout, the graph itself is not shown (no nodes or links visible, but the minigraph type view in the bottom right, and zoom buttons in the top left are still visible) unless I click on the graph area or cause some other size change type event. The layout change request is being instigated by the user clicking a button that is not part of the graph itself (so a focus change will have occurred). When I do click back on the graph and the nodes appear, they look all in the right place. Is there another thing I can call in the LayoutCompleted handler that could be used to force the visibility (I appreciate that it is not normally required)?
thank you Walter. I have just tried the requestUpdate() and that resulted in the graph appearing correctly, and always visible after the layout change. I appreciate that it is not the ideal fix, but as this is a relatively infrequent operation by the user (changing the layout type) I think I can live with it as a work around until I can find the underlying cause.
I will look at the Fishbone example and see if there is anything there that I have missed.