Add chart to diagram

Hello

I’ve applilcation writen in JavaFX but I would like migrate it to GoJS.
My problem is that I don’t know how to add new charts (Peitty) to Diagram. Example from canvases.html don’t fit my problem because I would like add charts from code, not by click mouse.

Could You show my how simply define model with desire amount of charts and add Peitty (or other) to it?

JavaFX version

Regards
Marek

I can create a simple sample for you later today.

1 Like
<!DOCTYPE html>
<html>
<head>
<title>Minimal GoJS Sample</title>
<!-- Copyright 1998-2019 by Northwoods Software Corporation. -->
<meta charset="UTF-8">
<script src="https://cdnjs.cloudflare.com/ajax/libs/gojs/1.8.36/go.js"></script>
<script src="https://cdnjs.cloudflare.com/ajax/libs/jquery/3.3.0/jquery.js"></script>
<script src="https://cdnjs.cloudflare.com/ajax/libs/peity/1.2.0/jquery.peity.js"></script>
<script id="code">
  function init() {
    var $$ = go.GraphObject.make;

    myDiagram =
      $$(go.Diagram, "myDiagramDiv",
          {
            initialContentAlignment: go.Spot.Center,  // for v1.*
            layout: $$(go.TreeLayout, { angle: 90, layerSpacing: 30 }),
            "undoManager.isEnabled": true
          });

    myDiagram.nodeTemplate =
      $$(go.Node, "Vertical",
        $$(go.TextBlock,
          new go.Binding("text")),
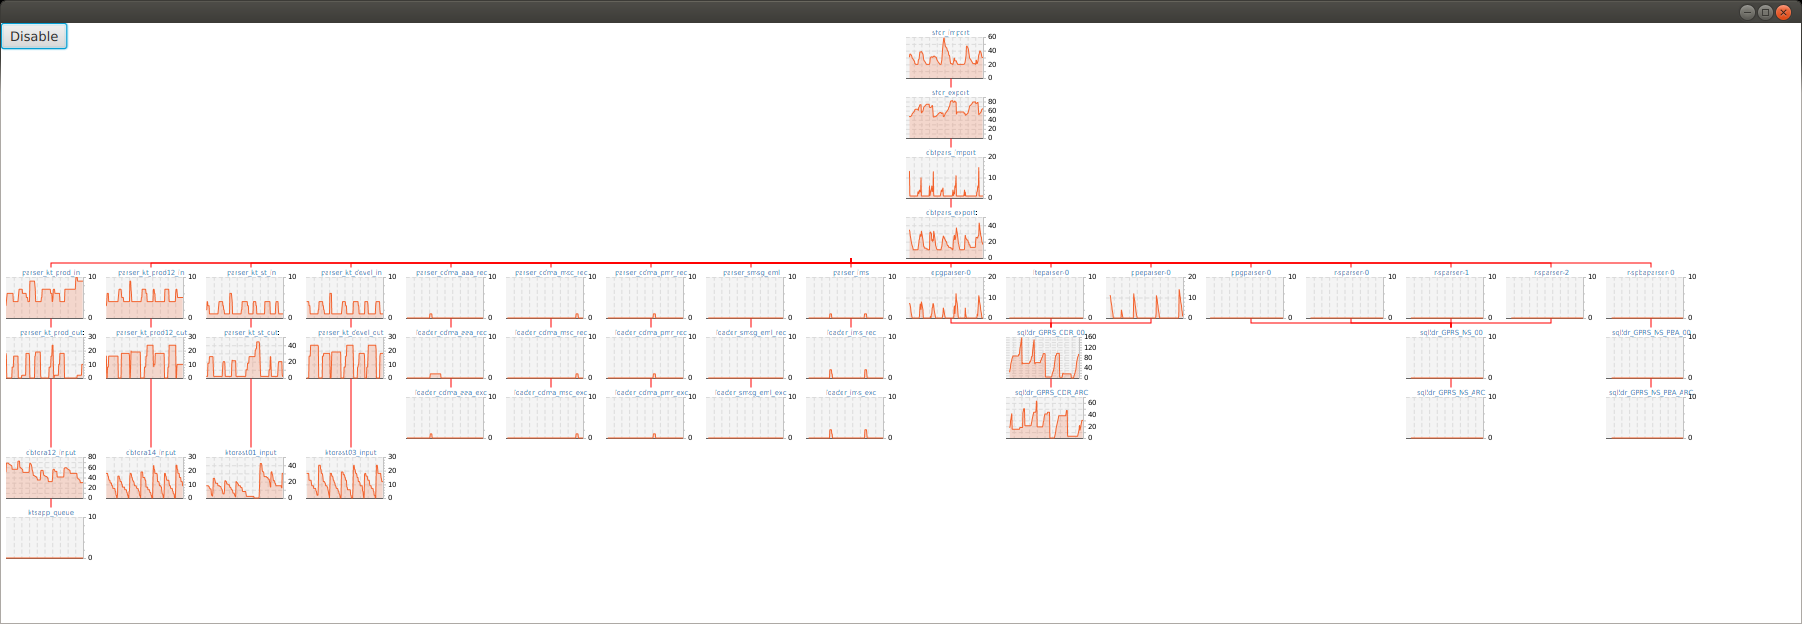
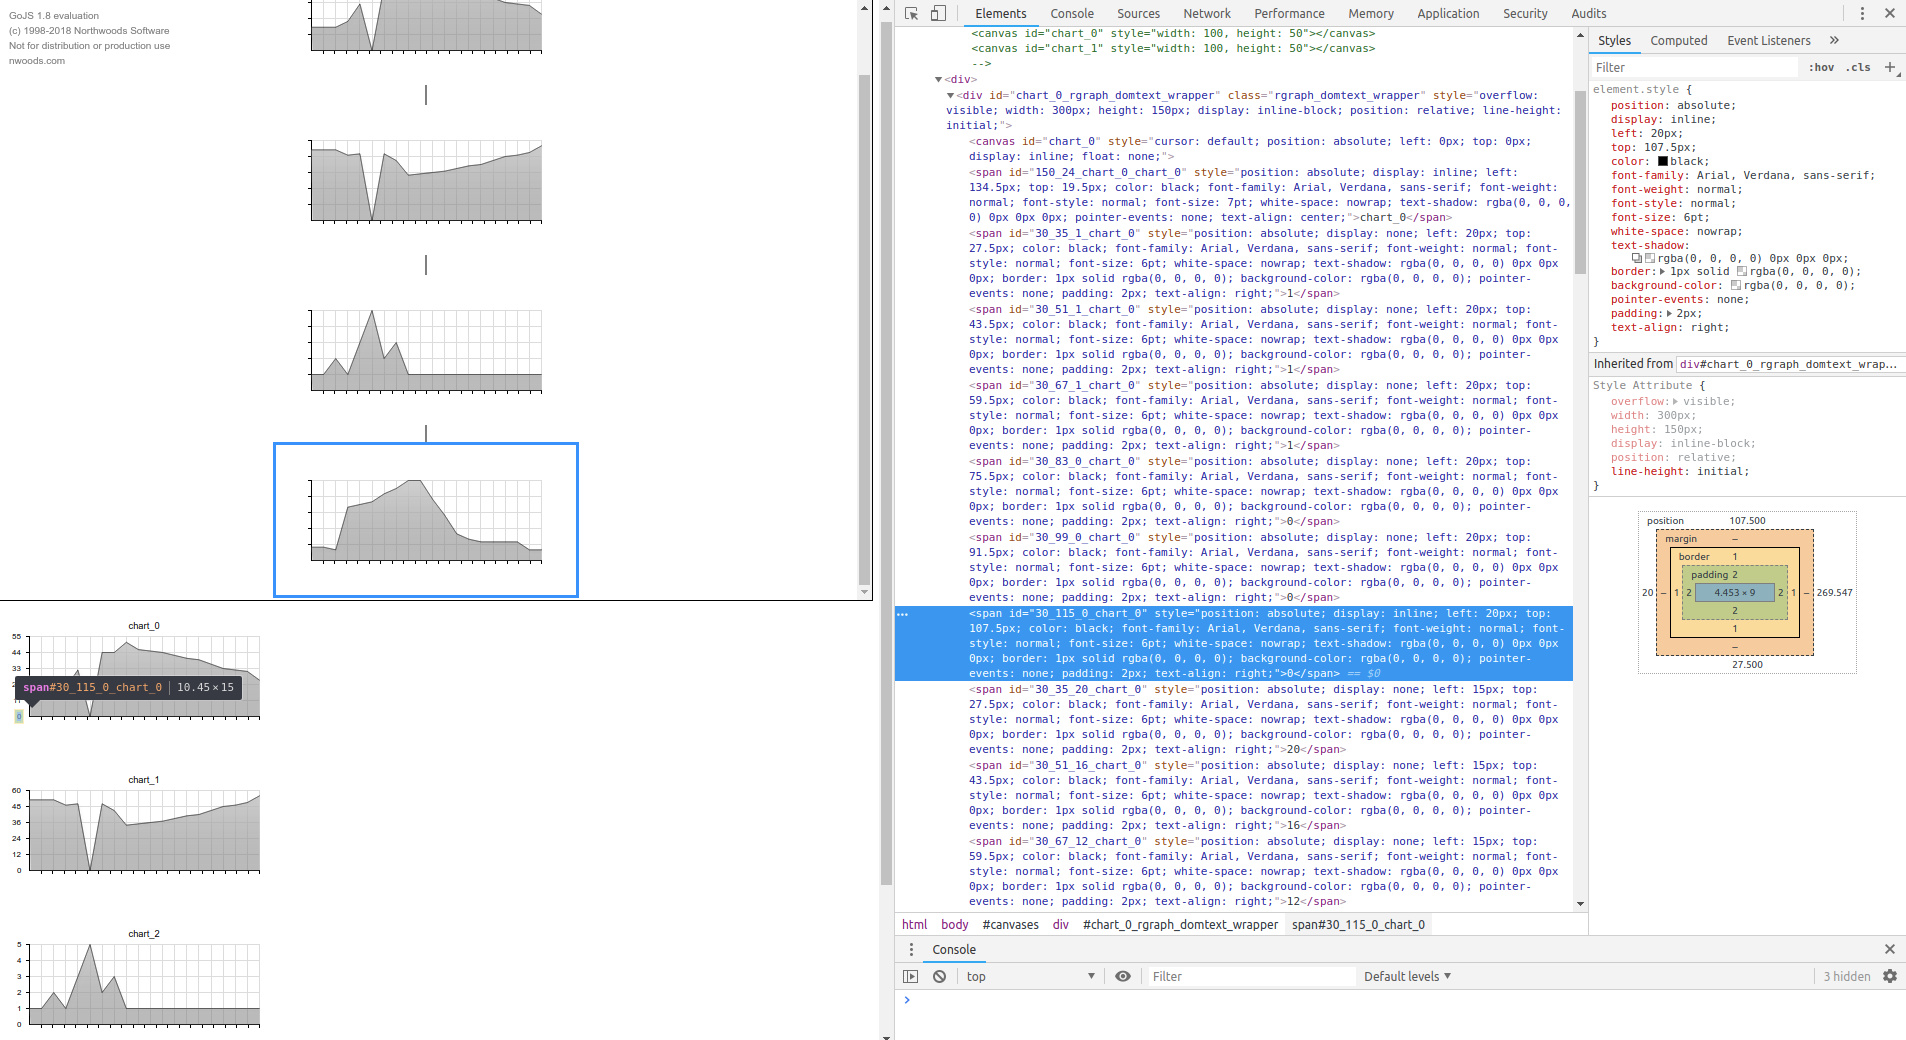
        $$(go.Picture,
          { width: 100, height: 50 },
          new go.Binding("element", "chart", makeChart))
      );

    function makeChart(data) {
      var span = document.createElement("span");
      span.id = "peity0";
      span.textContent = data.toString();
      var canvases = document.getElementById("canvases");
      canvases.appendChild(span);
      $("#peity0").peity("line", { width: 100, height: 50 });
      canvases.removeChild(span);
      var canvas = $(".peity")[0];
      canvases.removeChild(canvas);
      return canvas;
    }

    myDiagram.linkTemplate =
      $$(go.Link,
        { routing: go.Link.Orthogonal },
        $$(go.Shape)
      );

    myDiagram.model = new go.GraphLinksModel(
    [
      { key: 1, text: "Alpha", chart: [0, 7, 13, 11] },
      { key: 2, text: "Beta", chart: [20, 70, 130, 110] },
      { key: 3, text: "Gamma", chart: [3, 1, 4, 1, 5] },
      { key: 4, text: "Delta", chart: [123, 145, 134, 112, 132, 154, 143] }
    ],
    [
      { from: 1, to: 2 },
      { from: 1, to: 3 },
      { from: 3, to: 4 }
    ]);
  }
</script>
</head>
<body onload="init()">
  <div id="myDiagramDiv" style="border: solid 1px black; width:100%; height:600px"></div>
  <div id="canvases" style="display: none"></div>
</body>
</html>

Walter thank You. After winter holidays I will use it. Thank You very much.

Hello

I did some progres in my migration. I can create charts but I have problem with scale and title charts. This information are seen on buttom charts (displayed canvas for debug purpose) but I don’t know why that information disapers on diagram.
Any sugestion?

Regards

Peity charts don’t seem to have any labelled axes. I suggest that you use a different charting library. Remember that it must render to a Canvas element.

I use RGraph library for my charts.
I found problem - RGraph is coding all information (eg. Y axes, caption) in series of span elements, but GOJS takes only canvas node.

.

It is possible to display in Diagram main DIV (on attachemnt it is chart_0_rgraph_domtext_wrapper)?

No, one cannot embed HTML in Canvas. When we get a chance we’ll look for an alternative library to use in the sample.

1 Like

Well, the first one I looked at, Chart.js, seems to render a Canvas including axes and their labels:
https://www.chartjs.org/samples/latest/charts/line/basic.html

Sorry, I don’t have time at the moment to change the sample to use Chart.js instead of Peity. But that’s something that we should do.

It also is relatively easy to make sample charts entirely in GoJS. Maybe I should do that instead…

OK, here’s a sample that uses Chart.js: Various Charts in GoJS Nodes.
As usual, the complete implementation is in the page itself.

1 Like