hi sir
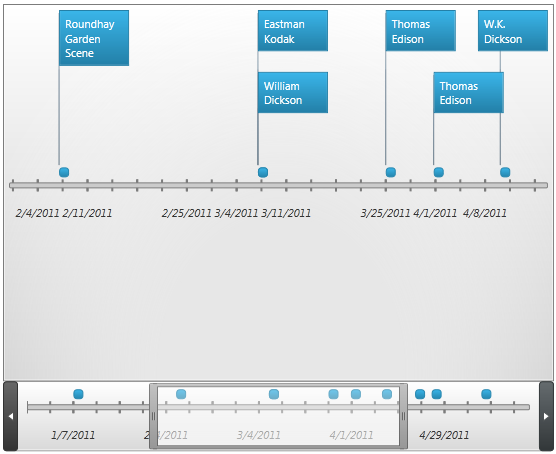
In Timeline visulization sample how the auto-adjust feature works when zooming in on a selected time segment of the data or zoom a certain level . For instance, if the Timeline is displaying several days worth of data, zooming into a specific day or zoom a certain level will adjust the tick marks to display hours.minute ext.
If you have implemented something like that screenshot, then presumably you know enough to be able to change the distance between the ticks and move the nodes to correspond.
That appears to be a draggable and resizable rectangular shape. (Presumably only resizable on the left and right sides – customize the Part.ResizeAdornmentTemplate to only have the handles on the left and right sides. The Sequential Function sample demonstrates that, but you might want to use taller handles.)
Then you just need to implement Diagram.SelectionMoved and Diagram.NodeResized event handlers to update the main diagram’s timeline. I guess the former just needs to scroll the diagram; the latter needs to change the distance between the tick marks and move all of the nodes as well as change the Diagram.Panel.Position.