Any examples of donut

Looking to generate Donut plot using gojs, checked in gallery. Donut plot mentioned here are different than the expected. Radial plot in gojs is some what similar to my example.

I would like to create three groups A, B, C and under each group I have few sub elements with values to display. So basically looking for two layer donut plot.

Example above, taken from internet.

All titles are expected on plot and not as shown in above diagram.

The Donut sample was intended to show an indicator of a single data property value.
I can extend the sample to show an Array of numbers or an Array of color-number pairs all rendered as annular segments of a single complete ring.
But I don’t know about labels, since those can be hard to fit.
Do you want to show labels, and if so, how?

Also, look at how radial buttons are implemented: Buttons in a Circular Adornment

Label as shown in image shared, would like to show on ring itself. We can see in image provided above, the one present on right side of image.

Also can you please help me with few example link for Donut chart matching to my requirement

[EDIT: moved to Two-level Donut Charts]

The older version of the code produced:

Thank you.

Tried changing size of div, but did not help. Which option to fine tune to increase the size of image. Need only second image.

Also can we change layout for label text display. Would like to display in angular way.

Sample image attached below

Each main group and number of elements in each group will vary. Would like to display the percentage in bracket only for outer elements

Did you see this line?

//new go.Binding("angle", "", ensureUpright),  // does the text need to be rotated?

Try uncommenting it.

Regarding the text that is shown, adapt the data conversion function used by the Binding of the TextBlock.text property.

What is the correct way to increase size of of image. Tried increasing thickness, but its becoming more clumsy.

Try the improved sample at: Two-level Donut Charts

Thank you.

I got your example, Thank you. Would like to run this utility as stand alone utility/program to convert the web page to png image. Have checked option using makesvg & makeblob, these works when we open in web bwroser.

I have integrated the gojs code in php and using phantomjs to convert same to png. When running code, its getting hung and not creating any output. When debugged it looks like getting stuck at normalizeData used in binding for values.

Can you help me to fix this or suggest me better approach example to achieve same.

That normalizeData function doesn’t involve any DOM, so I don’t see how it could be broken unless you are passing badly structured objects to it.

var page = require(‘webpage’).create();
page.content = “<div id=‘myDiagramDiv’ style=‘overflow:hidden’> <img id=‘myImg’ /></body></html>”;
// We include go.js before acting on our page, assuming it is in the same directory
page.injectJs(‘go.js’);
console.log(‘Initiated’);

page.onError = function(msg, trace) {

var msgStack = ['ERROR: ' + msg];

if (trace && trace.length) {
  msgStack.push('TRACE:');
  trace.forEach(function(t) {
    msgStack.push(' -> ' + t.file + ': ' + t.line + (t.function ? ' (in function '' + t.function +'')' : ''));
  });
}

console.error(msgStack.join('\n'));

};

page.evaluate(function() {
// GoJS is loaded, now we set up a diagram and make the image we want
var $ = go.GraphObject.make;

var myDiagram = $(go.Diagram, 'myDiagramDiv', // the ID of the DIV HTML element
                {
                  initialContentAlignment: go.Spot.TopCenter,  // center the content
                  initialAutoScale: go.Diagram.UniformToFill,
                  initialViewportSpot: go.Spot.TopCenter,
                  allowZoom: true
              });
// console.log('Diagram Initiated');

var Inner = 60;  // inner radius
var Thickness = 120;  // Inner + Thickness is outer radius
// console.log('var defined');
function normalizeData(arr) {
}

myDiagram.nodeTemplate =
    $(go.Node, 'Spot',
        $(go.Panel,
            new go.Binding('itemArray', 'values', normalizeData),
            {
                itemTemplate:
                    $(go.Panel, 'Spot',
                        $(go.Shape, // this always occupies the full circle
                        { fill: '#00000020', stroke: 'white' },
                        new go.Binding('geometry', '', makeAnnularWedge),
                        new go.Binding('fill', 'color')),
                        $(go.TextBlock,
                        { width: Thickness, textAlign: 'center', font: 'bold 8pt sans-serif' },
                        new go.Binding('alignment', '', computeTextAlignment),
                        new go.Binding('angle', '', ensureUpright),  // does the text need to be rotated?
                        new go.Binding('text', '', d => d.text + '(' + (d.sweep/3.60).toFixed(1) + '%)')),
                        {
                          toolTip: $('ToolTip',
                          $(go.TextBlock,
                            new go.Binding('text', '', d => `${d.text}\n#: ${d.value}\n${(d.sweep/3.60).toFixed(1)}%`)))
                        }
                    )
            }
          ),
          $(go.TextBlock,
            { maxSize: new go.Size(2*Inner, 2*Inner), font: 'bold 10pt sans-serif' },
            new go.Binding('text'))
    );

function normalizeData(arr) {
  let total = 0;
  var categories = [];
  arr.forEach(cat => {
      let cattot = 0;
      cat.data.forEach(det => {
      if (typeof det.value !== 'number') det.value = 1;
      total += det.value;
      cattot += det.value;
      });
      cat.value = cattot;
      categories.push(cat);
  });
  if (total <= 0) return [];
  var details = [];
  let angle = 270;
  arr.forEach(cat => {
      cat.angle = angle;
      cat.sweep = (cat.value/total) * 360;
      cat.radius = Inner;
      cat.thick = Thickness;
      cat.data.forEach(det => {
      det.angle = angle;
      var sw = (det.value/total) * 360;
      det.sweep = sw;
      angle += sw;
      det.radius = Inner + Thickness;
      det.thick = Thickness;
      if (!det.color) det.color = cat.color;
      details.push(det);
      });
  });
  return categories.concat(details);
}

function makeAnnularWedge(data) {
  var angle = (typeof data.angle === 'number') ? data.angle : 0;  // start angle
  var sweep = (typeof data.sweep === 'number') ? data.sweep : 90;
  var radius = (typeof data.radius === 'number') ? data.radius : Inner;  // inner radius
  var thick = (typeof data.thick === 'number') ? data.thick : Thickness;

  // the Geometry will be centered about (0,0)
  var outer = radius + thick;  // the outer radius
  var inner = radius;
  var p = new go.Point(outer, 0).rotate(angle);
  var q = new go.Point(inner, 0).rotate(angle + sweep);
  var rad = Inner + 2*Thickness;
  var geo = new go.Geometry()
      .add(new go.PathFigure(-rad, -rad))  // always make sure the Geometry includes the top left corner
      .add(new go.PathFigure(rad, rad))    // and the bottom right corner of the whole circular area
      .add(new go.PathFigure(p.x, p.y)  // start at outer corner, go clockwise
      .add(new go.PathSegment(go.PathSegment.Arc, angle, sweep, 0, 0, outer, outer))
      .add(new go.PathSegment(go.PathSegment.Line, q.x, q.y))  // to opposite inner corner, then anticlockwise
      .add(new go.PathSegment(go.PathSegment.Arc, angle + sweep, -sweep, 0, 0, inner, inner).close()));
  return geo;
}

function computeTextAlignment(data) {
  var angle = (typeof data.angle === 'number') ? data.angle : 0;  // start angle
  var sweep = (typeof data.sweep === 'number') ? data.sweep : 90;
  var radius = (typeof data.radius === 'number') ? data.radius : Inner;  // inner radius
  var thick = (typeof data.thick === 'number') ? data.thick : Thickness;
  var p = new go.Point(radius + thick / 2, 0).rotate(angle + sweep / 2);
  return new go.Spot(0.5, 0.5, p.x, p.y);
}

// only used if rotating the text labels
function ensureUpright(data) {
  var angle = (typeof data.angle === 'number') ? data.angle : 0;
  var sweep = (typeof data.sweep === 'number') ? data.sweep : 90;
  var a = angle + sweep/2;
  if (a > 90 && a < 270) return a + 180;
  return a;
}

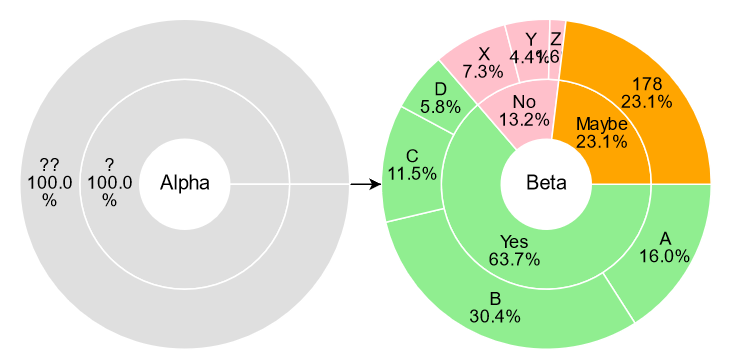
myDiagram.model = new go.GraphLinksModel(
[
  {
      key: 2, text: '',
      values: [
      {
          text: 'Yes',
          data: [
          { text: 'A', value: 123 },
          { text: 'B', value: 234 },
          { text: 'C', value: 89 },
          { text: 'D', value: 45 }
          ],
          color: '#6aaea2'
      },
      {
          text: 'No',
          data: [
          { text: 'X', value: 56 },
          { text: 'Y', value: 34 },
          { text: 'Z', value: 12 }
          ],
          color: '#ababac'
      },
      {
          text: 'Maybe',
          data: [
          { text: '178', value: 178 }
          ],
          color: '#547576'
      }
      ]
  },
],
[]);

var img = document.getElementById('myImg');
img.src = myDiagram.makeImageData({
	scale: 1,
	// PhantomJS tends to handle transparency poorly in the images it renders,
	// so we prefer to use a white background:
	background: 'white'
})
document.body.style.margin = '0px';

});

// We want to ensure that the image is done loading before we render
setInterval(function() {
var imgComplete = page.evaluate(function() {
return document.getElementById(‘myImg’).complete
});

if (imgComplete) {
// PhantomJS renders the entire page, and we just want to output the ,
// so we must clip to its bounding rect:
var clipRect = page.evaluate(function() {
return document.getElementById(‘myImg’).getBoundingClientRect();
});
page.clipRect = {
top: clipRect.top,
left: clipRect.left,
width: clipRect.width,
height: clipRect.height
}
page.render(‘mr.png’);
phantom.exit();
}
}, 100);

Tried updating complete code here but formatting got disturbed.

Integrated donut chart code into sample phantomJs code available on Gojs.

PhantomJS development stopped 4 years ago:
Archiving the project: suspending the development · Issue #15344 · ariya/phantomjs · GitHub
So I have no confidence that it still works reliably.

Try Puppeteer:
Server-Side Images with GoJS -- Northwoods Software

PhantomJs, have tried and is working for other example.

Also tried puppeteer, its giving error for sample example provided on single. Error as below, can you please guide on same, I am using on centos 64 bit

(node:12917) UnhandledPromiseRejectionWarning: Error: Failed to launch the browser process!
[0318/164838.247142:FATAL:zygote_host_impl_linux.cc(117)] No usable sandbox! Update your kernel or see Chromium Docs - Linux SUID Sandbox Development for more information on developing with the SUID sandbox. If you want to live dangerously and need an immediate workaround, you can try using --no-sandbox.
#0 0x7f8184978469 base::debug::CollectStackTrace()
#1 0x7f81848def33 base::debug::StackTrace::StackTrace()
#2 0x7f81848f1d50 logging::LogMessage::~LogMessage()
#3 0x7f81829b25db content::ZygoteHostImpl::Init()
#4 0x7f818448bdf2 content::ContentMainRunnerImpl::Initialize()
#5 0x7f8184489eb9 content::RunContentProcess()
#6 0x7f818448a00e content::ContentMain()
#7 0x7f81844e4fca headless::(anonymous namespace)::RunContentMain()
#8 0x7f81844e4cd5 headless::HeadlessShellMain()
#9 0x7f81810d6668 ChromeMain
#10 0x7f8178e3f555 __libc_start_main
#11 0x7f81810d64aa _start

Received signal 6
#0 0x7f8184978469 base::debug::CollectStackTrace()
#1 0x7f81848def33 base::debug::StackTrace::StackTrace()
#2 0x7f8184977f71 base::debug::(anonymous namespace)::StackDumpSignalHandler()
#3 0x7f817d59a630 (/usr/lib64/libpthread-2.17.so+0xf62f)
#4 0x7f8178e53387 __GI_raise
#5 0x7f8178e54a78 __GI_abort
#6 0x7f81849771f5 base::debug::BreakDebuggerAsyncSafe()
#7 0x7f81848f2221 logging::LogMessage::~LogMessage()
#8 0x7f81829b25db content::ZygoteHostImpl::Init()
#9 0x7f818448bdf2 content::ContentMainRunnerImpl::Initialize()
#10 0x7f8184489eb9 content::RunContentProcess()
#11 0x7f818448a00e content::ContentMain()
#12 0x7f81844e4fca headless::(anonymous namespace)::RunContentMain()
#13 0x7f81844e4cd5 headless::HeadlessShellMain()
#14 0x7f81810d6668 ChromeMain
#15 0x7f8178e3f555 __libc_start_main
#16 0x7f81810d64aa _start
r8: 0000000000000000 r9: 0000000000000300 r10: 0000000000000008 r11: 0000000000000202
r12: 00007ffc3fb1ab20 r13: 00007ffc3fb1ab38 r14: 00007ffc3fb1ab30 r15: 00002cec00221400
di: 0000000000003280 si: 0000000000003280 bp: 00007ffc3fb19aa0 bx: 00007ffc3fb1a2e0
dx: 0000000000000006 ax: 0000000000000000 cx: ffffffffffffffff sp: 00007ffc3fb19968
ip: 00007f8178e53387 efl: 0000000000000202 cgf: 0000000000000033 erf: 0000000000000000
trp: 0000000000000000 msk: 0000000000000000 cr2: 0000000000000000
[end of stack trace]

TROUBLESHOOTING: puppeteer/troubleshooting.md at main · puppeteer/puppeteer · GitHub

at onClose (/opt/lampp/htdocs/node_modules/puppeteer/lib/cjs/puppeteer/node/BrowserRunner.js:237:20)
at Interface.<anonymous> (/opt/lampp/htdocs/node_modules/puppeteer/lib/cjs/puppeteer/node/BrowserRunner.js:227:68)
at Interface.emit (events.js:326:22)
at Interface.close (readline.js:416:8)
at Socket.onend (readline.js:194:10)
at Socket.emit (events.js:326:22)
at endReadableNT (_stream_readable.js:1241:12)
at processTicksAndRejections (internal/process/task_queues.js:84:21)

(node:12917) UnhandledPromiseRejectionWarning: Unhandled promise rejection. This error originated either by throwing inside of an async function without a catch block, or by rejecting a promise which was not handled with .catch(). To terminate the node process on unhandled promise rejection, use the CLI flag --unhandled-rejections=strict (see Command-line API | Node.js v19.5.0 Documentation). (rejection id: 1)
(node:12917) [DEP0018] DeprecationWarning: Unhandled promise rejections are deprecated. In the future, promise rejections that are not handled will terminate the Node.js process with a non-zero exit code.

I’m sorry, but those problems do not appear to involve GoJS.