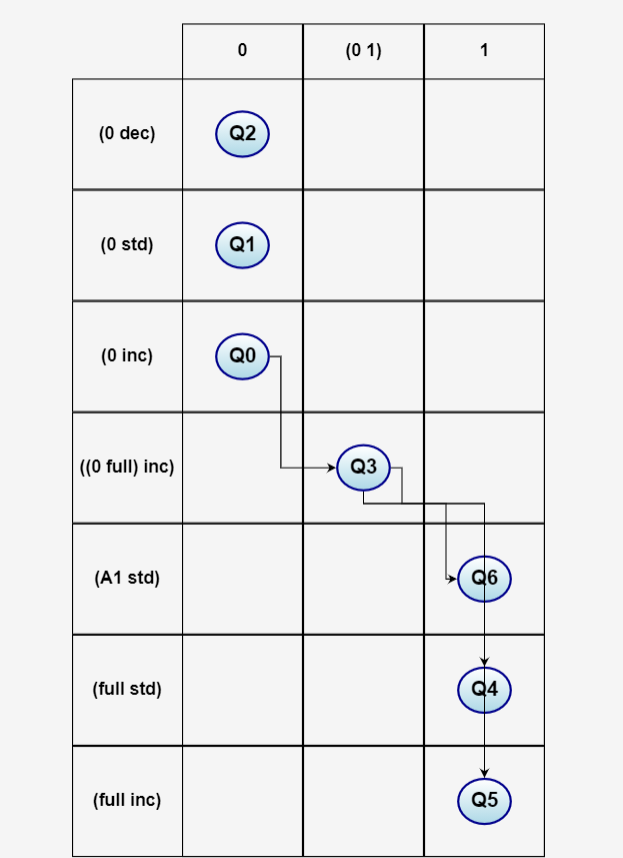
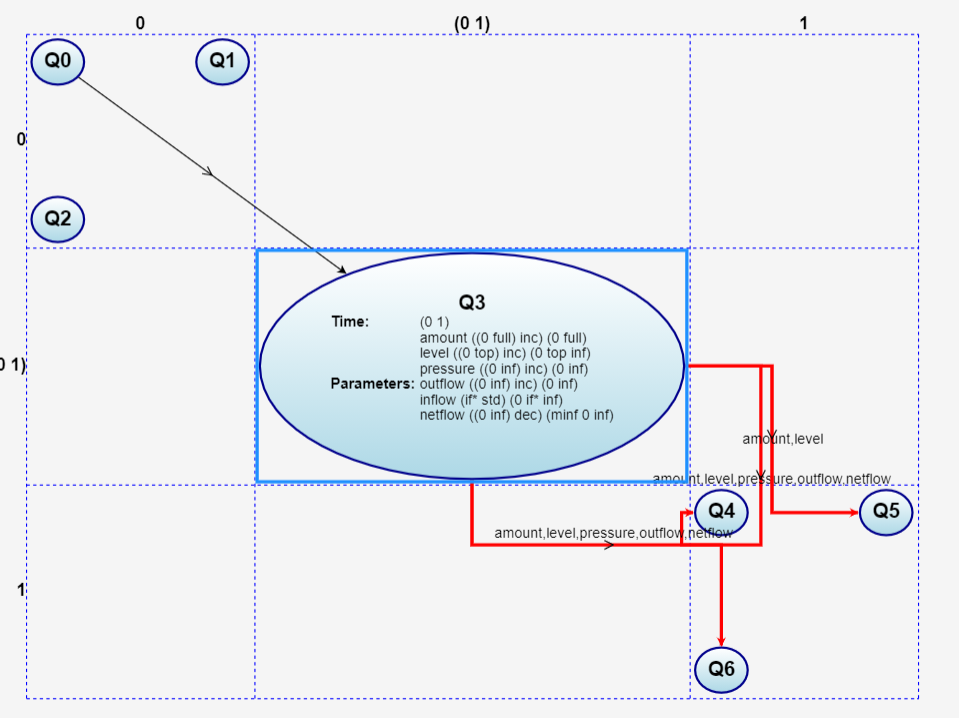
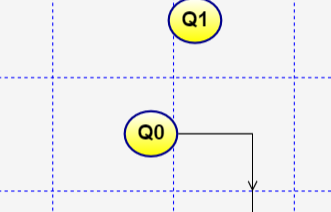
Arrange nodes to bands by horizontal and vertical

Hi There!

I have my diagram:

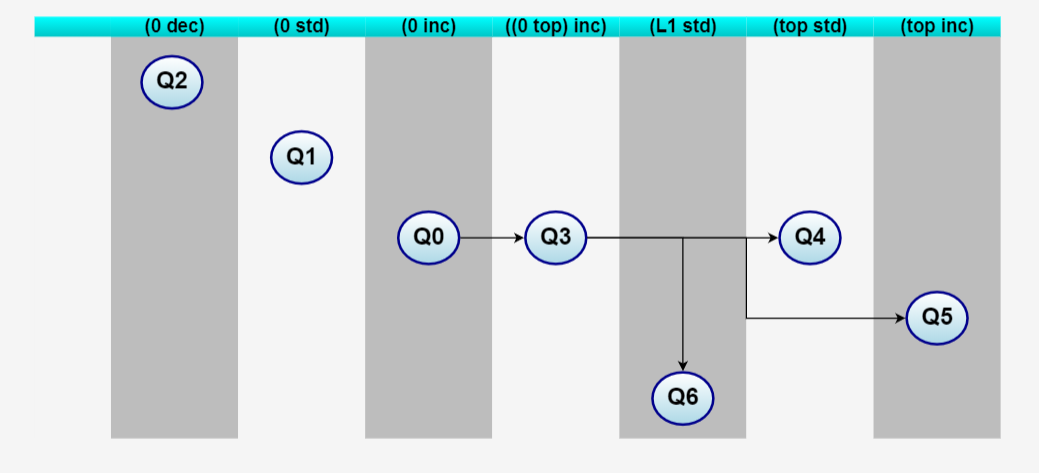
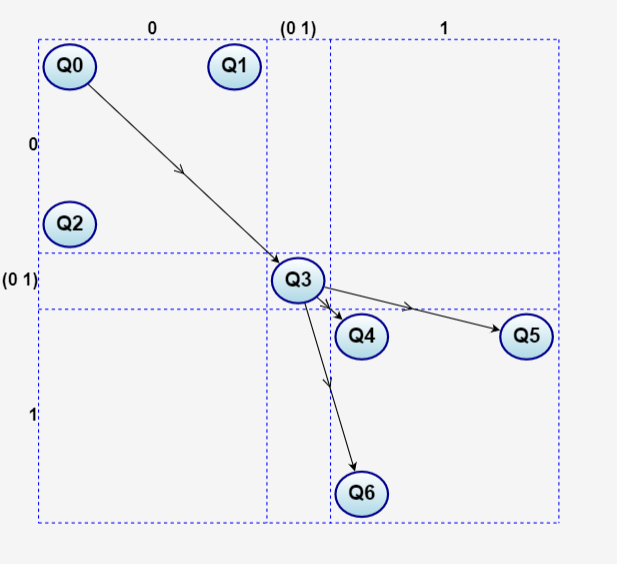
that order here by horizontal.

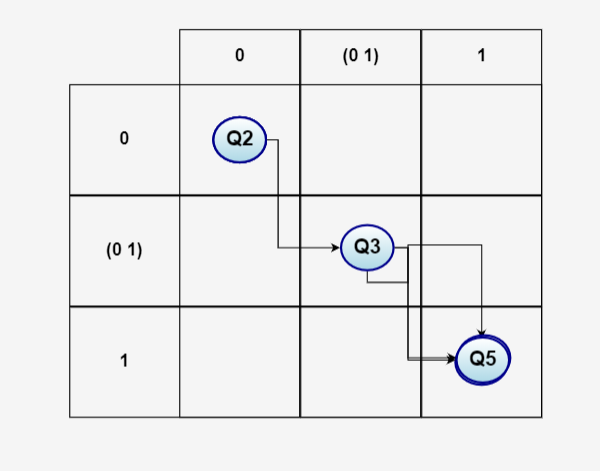
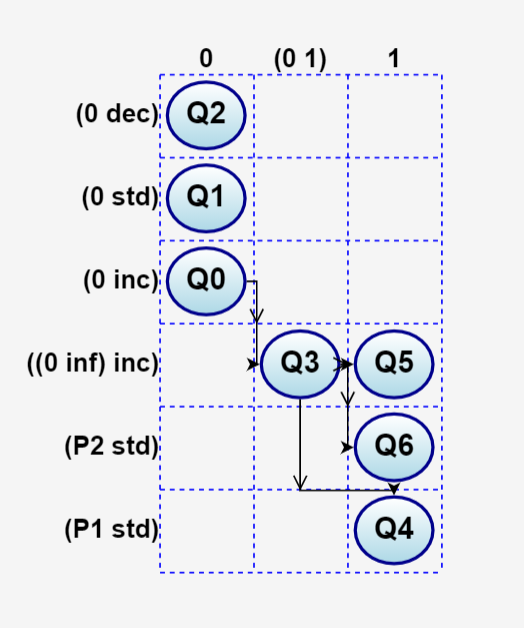
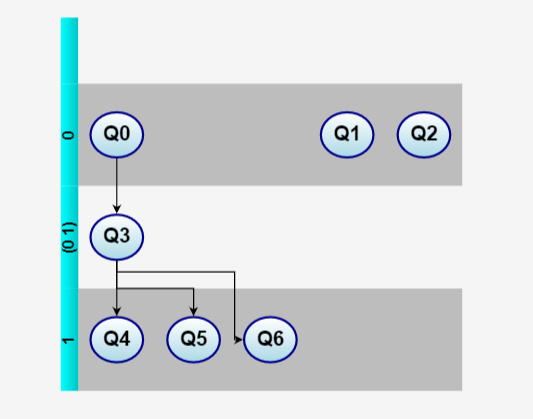
and here it sorted by vertical:

image

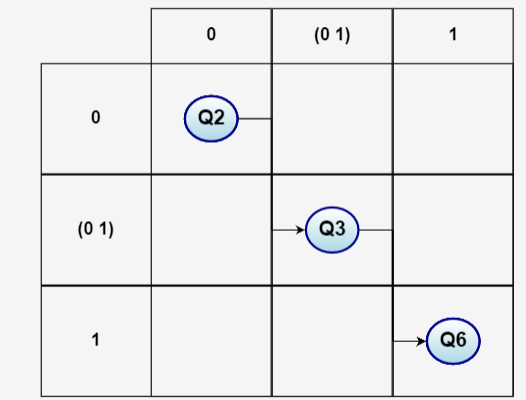
I want to display bands in horizontal and vertical and arrange the nodes in some a matrix - such every node get band (x,y) and not just x or just y.

my code:

public initDiagram(): go.Diagram {
        // this controls whether the layout is horizontal and the layer bands are vertical, or vice-versa:
        let HORIZONTAL = this.horizontal;  // this constant parameter can only be set here, not dynamically

        // Perform a TreeLayout where the node's actual tree-layer is specified by the "band" property on the node data.
        // This implementation only works when angle == 0, but could be easily modified to support other angles.
        function BandedTreeLayout() {
            go.TreeLayout.call(this);

            this.treeStyle = go.TreeLayout.StyleLayered;  // required
            // new in GoJS v1.4
            this.layerStyle = go.TreeLayout.LayerUniform;

            // don't move subtrees closer together, to maintain possible empty spaces between layers
            this.compaction = go.TreeLayout.CompactionNone;
            // move the parent node towards the top of its subtree area
            this.alignment = go.TreeLayout.AlignmentStart;

            // sort a parent's child vertexes by the value of the index property
            function compareIndexes(v, w) {
                var vidx = v.index;
                if (vidx === undefined) vidx = 0;
                var widx = w.index;
                if (widx === undefined) widx = 0;
                return vidx - widx;
            }

            this.sorting = go.TreeLayout.SortingAscending;
            this.comparer = compareIndexes;

            //this.setsPortSpot = false;
            this.setsChildPortSpot = false;
        }

        go.Diagram.inherit(BandedTreeLayout, go.TreeLayout);

        // Modify the standard LayoutNetwork by making children with the same "band" value as their
        // parents actually be children of the grandparent.
        BandedTreeLayout.prototype.makeNetwork = function (coll) {
            var net = go.TreeLayout.prototype.makeNetwork.call(this, coll);
            // add artificial root and link with all root vertexes
            var singles = [];
            for (var it = net.vertexes.iterator; it.next();) {
                var v = it.value;
                if (v.node && v.sourceEdges.count === 0) {
                    singles.push(v);
                }
            }
            if (singles.length > 0) {
                var dummyroot = net.createVertex();
                net.addVertex(dummyroot);
                singles.forEach(function (v) {
                    net.linkVertexes(dummyroot, v, null);
                });
            }
            // annotate every child with an index, used for sorting
            for (var it = net.vertexes.iterator; it.next();) {
                var parent = it.value;
                var idx = 0;
                for (var cit = parent.destinationVertexes; cit.next();) {
                    var child = cit.value;
                    child.index = idx;
                    idx += 10000;
                }
            }
            // now look for children with the same band value as their parent
            for (var it = net.vertexes.iterator; it.next();) {
                var parent = it.value;
                if (!parent.node) continue;
                // Should this be recursively looking for grandchildren/greatgrandchildren that
                // have the same band as this parent node??  Assume that is NOT required.
                var parentband = parent.node.data.band;
                var edges = [];
                for (var eit = parent.destinationEdges; eit.next();) {
                    var edge = eit.value;
                    var child = edge.toVertex;
                    if (!child.node) continue;
                    var childband = child.node.data.band;
                    if (childband <= parentband) edges.push(edge);
                }
                // for each LayoutEdge that connects the parent vertex with a child vertex
                // whose node has the same band #, reconnect the edge with the parent's parent vertex
                var grandparent = parent.sourceVertexes.first();
                if (grandparent !== null) {
                    var cidx = 1;
                    for (var i = 0; i < edges.length; i++) {
                        var e = edges[i];
                        parent.deleteDestinationEdge(e);
                        e.fromVertex = grandparent;
                        grandparent.addDestinationEdge(e);
                        var child = e.toVertex;
                        child.index = parent.index + cidx;
                        cidx++;
                    }
                }
            }
            return net;
        };

        BandedTreeLayout.prototype.assignTreeVertexValues = function (v) {
            if (v.node && v.node.data && v.node.data.band) {
                v.originalLevel = v.level;  // remember tree assignment
                v.level = Math.max(v.level, v.node.data.band);  // shift down to meet band requirement
            }
        };

        BandedTreeLayout.prototype.commitLayers = function (layerRects, offset) {
            // for debugging:
            //for (var i = 0; i < layerRects.length; i++) {
            //  if (window.console) window.console.log(layerRects[i].toString());
            //}

            for (var it = this.network.vertexes.iterator; it.next();) {
                var v = it.value;
                var n = v.node;
                if (n && v.originalLevel) {
                    // the band specifies the horizontal position
                    var diff = n.data.band - v.originalLevel;
                    if (diff > 0) {
                        var pos = v.bounds.position;
                        // this assumes that the angle is zero: rightward growth
                        HORIZONTAL ? pos.x = layerRects[v.level].x : pos.y = layerRects[v.level].y;
                        n.move(pos);
                    }
                }
            }

            // update the background object holding the visual "bands"
            var bands = this.diagram.findPartForKey("_BANDS");
            if (bands) {
                bands.layerRects = layerRects;  // remember the Array of Rect

                var model = this.diagram.model;
                for (var it = this.network.vertexes.iterator; it.next();) {
                    var v = it.value;
                    if (!v.node) continue;
                    model.setDataProperty(v.node.data, "band", v.level);
                }

                bands.location = this.arrangementOrigin.copy().add(offset);

                var arr = bands.data.itemArray;
                for (var i = 0; i < layerRects.length; i++) {
                    var itemdata = arr[i];
                    if (itemdata) {
                        model.setDataProperty(itemdata, "bounds", layerRects[i]);
                    }
                }
            }
        };

        const $ = go.GraphObject.make;
        const dia = $(go.Diagram, {
            // @ts-ignore
            layout: $(BandedTreeLayout,  // custom layout is defined above
                {
                    angle: HORIZONTAL ? 0 : 90,
                    arrangement: HORIZONTAL ? go.TreeLayout.ArrangementVertical : go.TreeLayout.ArrangementHorizontal
                }),
            'initialContentAlignment': go.Spot.Center,
            'undoManager.isEnabled': true,
            model: $(go.GraphLinksModel,
                {
                    linkToPortIdProperty: 'toPort',
                    linkFromPortIdProperty: 'fromPort',
                    linkKeyProperty: 'key' // IMPORTANT! must be defined for merges and data sync when using GraphLinksModel
                }
            ),

        });


dia.nodeTemplateMap.add("Bands",
            $(go.Part, "Position",
                new go.Binding("itemArray"),
                {
                    isLayoutPositioned: false,  // but still in document bounds
                    locationSpot: new go.Spot(0, 0, HORIZONTAL ? 0 : 16, HORIZONTAL ? 16 : 0),  // account for header height
                    layerName: "Background",
                    pickable: false,
                    selectable: false,
                    itemTemplate:
                        $(go.Panel, HORIZONTAL ? "Vertical" : "Horizontal",
                            new go.Binding("opacity", "visible", function (v) {
                                return v ? 1 : 0;
                            }),
                            new go.Binding("position", "bounds", function (b) {
                                return b.position;
                            }),
                            $(go.TextBlock,
                                {
                                    angle: HORIZONTAL ? 0 : 270,
                                    textAlign: "center",
                                    wrap: go.TextBlock.None,
                                    font: "bold 11pt sans-serif",
                                    background: $(go.Brush, "Linear", {0: "aqua", 1: go.Brush.darken("aqua")})
                                },
                                new go.Binding("text"),
                                // always bind "width" because the angle does the rotation
                                new go.Binding("width", "bounds", function (r) {
                                    return HORIZONTAL ? r.width : r.height;
                                })
                            ),
                            // option 1: rectangular bands:
                            $(go.Shape,
                                {stroke: null, strokeWidth: 0},
                                new go.Binding("desiredSize", "bounds", function (r) {
                                    return r.size;
                                }),
                                new go.Binding("fill", "itemIndex", function (i) {
                                    return i % 2 == 0 ? "whitesmoke" : go.Brush.darken("whitesmoke");
                                }).ofObject())
                            // option 2: separator lines:
                            //(HORIZONTAL
                            //  ? $(go.Shape, "LineV",
                            //      { stroke: "gray", alignment: go.Spot.TopLeft, width: 1 },
                            //      new go.Binding("height", "bounds", function(r) { return r.height; }),
                            //      new go.Binding("visible", "itemIndex", function(i) { return i > 0; }).ofObject())
                            //  : $(go.Shape, "LineH",
                            //      { stroke: "gray", alignment: go.Spot.TopLeft, height: 1 },
                            //      new go.Binding("width", "bounds", function(r) { return r.width; }),
                            //      new go.Binding("visible", "itemIndex", function(i) { return i > 0; }).ofObject())
                            //)
                        )
                }
            ));

nodes exmaple:

nodes: [{category: “Bands”, itemArray: [{visible: “false”}, {text: “0”}, {text: “(0 1)”}, {text: “1”}],…},…]

0: {category: “Bands”, itemArray: [{visible: “false”}, {text: “0”}, {text: “(0 1)”}, {text: “1”}],…}
1: {band: 1, category: “simple”, key: “Q0”,…}
2: {band: 1, category: “simple”, key: “Q1”,…}
3: {band: 1, category: “simple”, key: “Q2”,…}
4: {band: 2, category: “simple”, key: “Q3”,…}
. 5: {band: 3, category: “simple”, key: “Q4”,…}
6: {band: 3, category: “simple”, key: “Q5”,…}
7: {band: 3, category: “simple”, key: “Q6”,…}

Thank you so much!!

BR,

Amit.

Use TableLayout.
TableLayout | GoJS API
Table Layout
Table Layout with DnD and Resizing

You might not care about the LaneResizingTool.

Hi there :)

I have a lot of logic in my code: for example adding a dummy parent to all the singles, and e.t.c

How can I Inherit all this logic?

If it’s not too much to ask, please help me with that If you can.

Thanks and have a nice day,

Amit.

You don’t need a custom TreeLayout. Because you are specifying both the x and y (or column and row) for each node, the layout gets a lot easier.

But the extras/TableGeneral.html sample, which I think is closest to what you want, does depend on Groups instead of a single background Part to hold the “bands” or “lanes”. I don’t know if that is an issue for you or not.

Hi Walter :)

I did it but I have some questions

  1. In case I have some nodes in cell I got this table:
    image

image

How can I arrange them nicely? :)

here my nodesTemplate:

 var nodeSimpleTemplate =
            $(go.Node, "Auto",mouseEventHandlers(),
                new go.Binding("row").makeTwoWay(),
                new go.Binding("column", "col").makeTwoWay(),
                new go.Binding("alignment", "align", go.Spot.parse).makeTwoWay(go.Spot.stringify),
                new go.Binding("layerName", "isSelected", function(s) { return s ? "Foreground" : ""; }).ofObject(),
                {
                    //locationSpot: go.Spot.Center,
                    // when the user clicks on a Node, highlight all Links coming out of the node
                    // and all of the Nodes at the other ends of those Links.
                    click: function (e, node) {
                        var diagram = node.diagram;
                        diagram.startTransaction("Click simple node");
                        diagram.clearHighlighteds();
                        // @ts-ignore
                        node.findLinksOutOf().each(function (l) {
                            changeLinkCategory(e, l);
                            l.isHighlighted = true;
                        });
                        // @ts-ignore
                        node.findNodesOutOf().each(function (n) {
                            n.isHighlighted = true;
                        });
                        changeNodeCategory(e, node);
                        diagram.commitTransaction("Click simple node");
                    }
                },
                $(go.Shape, "Ellipse",
                    {
                        fill: $(go.Brush, "Linear", {0: "white", 1: "lightblue"}),
                        stroke: "darkblue", strokeWidth: 2
                    }),
                $(go.Panel, "Table",
                    {defaultAlignment: go.Spot.Left, margin: 4},
                    $(go.RowColumnDefinition, {column: 1, width: 4}),
                    $(go.TextBlock,
                        {row: 0, column: 0, columnSpan: 3, alignment: go.Spot.Center},
                        {font: "bold 14pt sans-serif"},
                        new go.Binding("text", "key"))
                ));

        var nodeDetailedTemplate =
            $(go.Node, "Auto",mouseEventHandlers(),
                new go.Binding("row").makeTwoWay(),
                new go.Binding("column", "col").makeTwoWay(),
                new go.Binding("alignment", "align", go.Spot.parse).makeTwoWay(go.Spot.stringify),
                new go.Binding("layerName", "isSelected", function(s) { return s ? "Foreground" : ""; }).ofObject(),
                {
                    //locationSpot: go.Spot.Center,
                    // when the user clicks on a Node, highlight all Links coming out of the node
                    // and all of the Nodes at the other ends of those Links.
                    click: function (e, node) {
                        var diagram = node.diagram;
                        diagram.startTransaction("Click Details node");
                        diagram.clearHighlighteds();
                        // @ts-ignore
                        node.findLinksOutOf().each(function (l) {
                            changeLinkCategory(e, l);
                            l.isHighlighted = true;
                        });
                        // @ts-ignore
                        node.findNodesOutOf().each(function (n) {
                            n.isHighlighted = true;
                        });
                        changeNodeCategory(e, node);
                        diagram.commitTransaction("Click Details node");
                    }
                },

                $(go.Shape, "Ellipse",
                    {
                        fill: $(go.Brush, "Linear", {0: "white", 1: "lightblue"}),
                        stroke: "darkblue", strokeWidth: 2
                    }),
                $(go.Panel, "Table",
                    {defaultAlignment: go.Spot.Left, margin: 4},
                    $(go.RowColumnDefinition, {column: 1, width: 4}),
                    $(go.TextBlock,
                        {row: 0, column: 0, columnSpan: 3, alignment: go.Spot.Center},
                        {font: "bold 14pt sans-serif"},
                        new go.Binding("text", "key")),
                    $(go.TextBlock, "Time: ",
                        {row: 1, column: 0}, {font: "bold 10pt sans-serif"}),
                    $(go.TextBlock,
                        {row: 1, column: 2},
                        new go.Binding("text", "time")),
                    $(go.TextBlock, "Parameters: ",
                        {row: 2, column: 0}, {font: "bold 10pt sans-serif"}),
                    $(go.TextBlock,
                        {row: 2, column: 2},
                        new go.Binding("text", "parameters"))
                )
            );

        // for each of the node categories, specify which template to use
        dia.nodeTemplateMap.add("simple", nodeSimpleTemplate);
        dia.nodeTemplateMap.add("detailed", nodeDetailedTemplate);
  1. I have 2 link templates. when I click node, his links become red and display the edge_text

here:

how could I display them correctly?

here my code:

  var simpleLinkTemplate =
            $(go.Link, {toShortLength: 4, reshapable: true, resegmentable: true, routing: go.Link.AvoidsNodes},

                $(go.Shape,
                    // when highlighted, draw as a thick red line
                    new go.Binding("stroke", "isHighlighted", function (h) {
                        return h ? "red" : "black";
                    })
                        .ofObject(),
                    new go.Binding("strokeWidth", "isHighlighted", function (h) {
                        return h ? 3 : 1;
                    })
                        .ofObject()),

                $(go.Shape,
                    {toArrow: "Standard", strokeWidth: 0},
                    new go.Binding("fill", "isHighlighted", function (h) {
                        return h ? "red" : "black";
                    })
                        .ofObject())
            );

        var detailsLinkTemplate =
            $(go.Link, {toShortLength: 4, reshapable: true, resegmentable: true, routing: go.Link.AvoidsNodes},

                $(go.Shape,
                    // when highlighted, draw as a thick red line
                    new go.Binding("stroke", "isHighlighted", function (h) {
                        return h ? "red" : "black";
                    })
                        .ofObject(),
                    new go.Binding("strokeWidth", "isHighlighted", function (h) {
                        return h ? 3 : 1;
                    })
                        .ofObject()),

                $(go.Shape,
                    {toArrow: "Standard", strokeWidth: 0},
                    new go.Binding("fill", "isHighlighted", function (h) {
                        return h ? "red" : "black";
                    })
                        .ofObject())
                ,
                $(go.TextBlock, new go.Binding("text", "text"), {segmentOffset: new go.Point(0, -10)}),
            );

        linkTemplateMap.add("simple", simpleLinkTemplate);
        linkTemplateMap.add("detailed", detailsLinkTemplate);
  1. I want to drag node and open it and he will keep is location - when I open the node he returns to the original location. when I drag it to anther cell he is staying there but If i drag it to outside from the table, he returns to the cell.

Thank you so much for your help!

BR,

Amit.

You are using AvoidsNodes routing for Links, which is good. But then you also need to make sure that the links do not try to avoid the Groups, yes? So you need to set avoidable to false on your Group template(s).

Hi!

Thank you for your response.

Can you help me with the overlap nodes in the table? and the original location reset? that very important to me :)

and for your answer of avoidable:false --> that’s the result:

image

there is a change to make the borders more “smaller”? I want to see the edges clearly - If you have another idea - please go ahead :)

Thank you so much!

BR,

Amit

Everything that is drawn that isn’t text or an image is implemented by a Shape. You want to change the values of Shape.strokeWidth and perhaps Shape.stroke.

It might also help to set Link.curviness to some small value such as 4.

So you are using TableLayout, yes? Have you tried setting alignment on each node in order to position them differently within each cell? You could do that dynamically in an override of TableLayout.afterArrange.

If you want to increase the size of a cell based on how many or how large the nodes are in a particular cell, you’ll need to override TableLayout.beforeMeasure.

Hi!
about Shape.strokeWidth and perhaps Shape.stroke

Where I can even remove the borders? I using TableLayout - I can define it? I can’t find it in my code

you can send me an example TableLayout.afterArrange or TableLayout.beforeMeasure ?
I try to find it on google and I not find something similar to my diagram :(

Thank you :)

The rows and the columns are implemented by Groups. Modify the Shape that the Group uses.

Thanks! and what about TableLayout.afterArrange or TableLayout.beforeMeasure?

I’m really tried to find an example and I need your help if you can :(

Thanks a lot!

Hi there!

here my groups:

dia.groupTemplateMap.add("Column",
            $(go.Group, groupStyle(),

                new go.Binding("column", "col"),
                {
                    row: 0,
                    rowSpan: 9999,
                  stretch: go.GraphObject.Fill,
                  //avoidable:false,
                  resizeAdornmentTemplate:
                        $(go.Adornment, "Spot",
                            $(go.Placeholder),
                            $(go.Shape,  // for changing the width of a column
                                {
                                    alignment: new go.Spot(1, 0.0001), alignmentFocus: go.Spot.Top,
                                    desiredSize: new go.Size(7, 50),
                                    fill: "lightblue", stroke: "dodgerblue",
                                    cursor: "col-resize"
                                })
                        )
                }
            ));

        dia.groupTemplateMap.add("Row",
            $(go.Group, groupStyle(),
                new go.Binding("row"),
                {
                    column: 0,
                    columnSpan: 9999,
                  //avoidable:false,
                    resizeAdornmentTemplate:
                        $(go.Adornment, "Spot",
                            $(go.Placeholder),
                            $(go.Shape,  // for changing the height of a row
                                {
                                    alignment: new go.Spot(0.0001, 1), alignmentFocus: go.Spot.Left,
                                    desiredSize: new go.Size(100, 7),
                                    fill: "lightblue", stroke: "dodgerblue",
                                    cursor: "row-resize"
                                })
                        )
                }
            ));

How can I change the Shapes? I don’t get it :(
Please help :)

Thank you!

Never mind the above code. Here is a sample that doesn’t use Groups at all and lets you arrange multiple nodes within each cell how you like:
Table Layout with custom Layout of each cell

If you don’t set TableCellLayout.cellLayout to a useful layout, it acts pretty much like TableLayout but with a grid of lines separating the rows and columns.

If you provide a TableCellLayout.cellLayout, that layout is applied to the Nodes and Links that are in each cell, if there is more than one Part in the cell. The sample uses a GridLayout with GridLayout.wrappingColumn set to 1 to arrange them all vertically, but you could do something else if you wanted.

Hi Walter!

I got this situation:

When I click node I got this scenario:

That’s not clear :(

Can you help me to display the edges correctly?

and still have no space in this scenario: :(

Do you know how to fix this?

I even try that cellSize: new go.Size(1000,1000) in cellLayout

Thank you so much!

Amit.

Increase the margin on the node template.

Great works!

Last question:

I got an exception : ERROR Error: RowColumnDefinition.minimum is not in the range >= 0: NaN

here my code:

  $(go.RowColumnDefinition, { row: 0, height: 50, minimum: 50, alignment: go.Spot.Bottom }),
                $(go.RowColumnDefinition, { column: 0, width: 100, minimum: 100, alignment: go.Spot.Right }),

and it’s happen ONLY IN THIS CASE:

  1. nodes: [{category: “simple”, col: 3, key: “Q0”,…}, {category: “simple”, col: 2, key: “Q1”,…},…]

  2. 0: {category: “simple”, col: 3, key: “Q0”,…}

1. category: "simple"
2. col: 3
3. key: "Q0"
4. parameters: "amount (0 inc) (0 full)↵level (0 inc) (0 top inf)↵pressure (0 inc) (0 inf)↵outflow (0 inc) (0 inf)↵inflow (if* std) (0 if* inf)↵netflow ((0 inf) dec) (minf 0 inf)↵"
5. row: 3
6. time: "0"
  1. 1: {category: “simple”, col: 2, key: “Q1”,…}
1. category: "simple"
2. col: 2
3. key: "Q1"
4. parameters: "amount (0 std) (0 full)↵level (0 std) (0 top inf)↵pressure (0 std) (0 inf)↵outflow (0 std) (0 inf)↵inflow (if* std) (0 if* inf)↵netflow (0 std) (minf 0 inf)↵"
5. row: 2
6. time: "0"
  1. 2: {category: “simple”, col: 1, key: “Q2”,…}
1. category: "simple"
2. col: 1
3. key: "Q2"
4. parameters: "amount (0 dec) (0 full)↵level (0 dec) (0 top inf)↵pressure (0 dec) (0 inf)↵outflow (0 dec) (0 inf)↵inflow (if* std) (0 if* inf)↵netflow ((minf 0) inc) (minf 0 inf)↵"
5. row: 1
6. time: "0"
  1. 3: {category: “simple”, col: 4, key: “Q3”,…}
1. category: "simple"
2. col: 4
3. key: "Q3"
4. parameters: "amount ((0 full) inc) (0 full)↵level ((0 top) inc) (0 top inf)↵pressure ((0 inf) inc) (0 inf)↵outflow ((0 inf) inc) (0 inf)↵inflow (if* std) (0 if* inf)↵netflow ((0 inf) dec) (minf 0 inf)↵"
5. row: 4
6. time: "(0 1)"
  1. 4: {category: “simple”, col: 6, key: “Q4”,…}
1. category: "simple"
2. col: 6
3. key: "Q4"
4. parameters: "amount (full std) (0 full)↵level (top std) (0 top inf)↵pressure (P1 std) (0 P1 inf)↵outflow (OF1 std) (0 OF1 inf)↵inflow (if* std) (0 if* inf)↵netflow (0 std) (minf 0 inf)↵"
5. row: 6
6. time: "1"
  1. 5: {category: “simple”, col: 4, key: “Q5”,…}
1. category: "simple"
2. col: 4
3. key: "Q5"
4. parameters: "amount (full inc) (0 full)↵level (top inc) (0 top inf)↵pressure ((0 inf) inc) (0 inf)↵outflow ((0 inf) inc) (0 inf)↵inflow (if* std) (0 if* inf)↵netflow ((0 inf) dec) (minf 0 inf)↵"
5. row: 4
6. time: "1"
  1. 6: {category: “simple”, col: 5, key: “Q6”,…}
1. category: "simple"
2. col: 5
3. key: "Q6"
4. parameters: "amount (A1 std) (0 A1 full)↵level (L1 std) (0 L1 top inf)↵pressure (P2 std) (0 P2 inf)↵outflow (OF2 std) (0 OF2 inf)↵inflow (if* std) (0 if* inf)↵netflow (0 std) (minf 0 inf)↵"
5. row: 5
6. time: "1"

Ah, sorry about that – it wasn’t handling Links correctly. Try again:
Table Layout with custom Layout of each cell

Hi Walter!

I’m sorry but I don’t understand :(

I’m already used the TableCellLayout :)
I got this exception in the scenario I showed you below (ONLY in this nodes data)

Thanks!

Amit.

I updated that page.

Great that works!!

image

I have trouble with dragging nodes… How can I enable dragging nodes free? out of the tables for example?

In the attached screen shot the node stuck in the middle of cells after some try to drag him away.

Thanks Walter! you are the best!!!