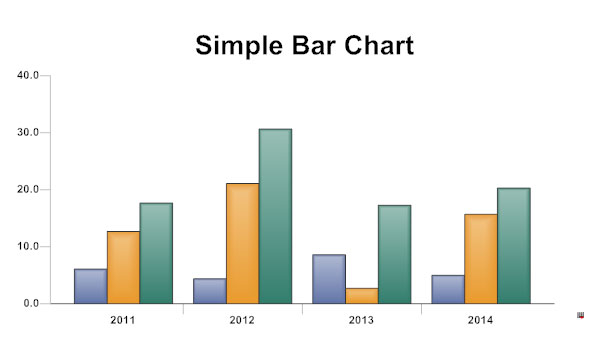
i m trying to make bargraphs using go js using this as base
first of all how to make the node size equal to some % of div size
second how to get lines ie cordinates representing x and y axis like in this

i m trying to make bargraphs using go js using this as base

Although you can use GoJS to draw a lot of different kinds of traditional data charts, it really isn’t designed to be good at that, so it requires more work than a good chart component requires. So you might want to use such a component. For example: Various Charts in GoJS Nodes
But if you really need it to be implemented in GoJS, that can be done. That might be desirable if you want users to select and manipulate the bars in your chart, for example to re-order them or to change their sizes.
GoJS explicitly avoids using percentage measurements, because the normal way to measure nodes and their elements is completely independent of the HTML DIV element. But you could certainly set the width (and height?) to some computed fraction of the HTML DIV element.
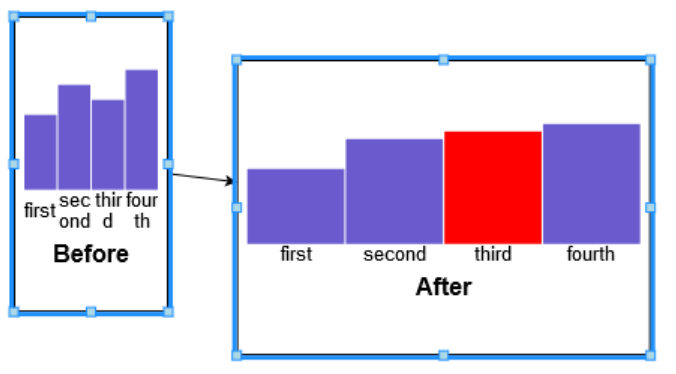
But that will only work if the node template is designed to be stretchy, which in that sample it is not. The reason is that each bar is specifically set to a width of 40. Remove that and add some { stretch: go.GraphObject.Horizontal } declarations, and set Node.resizable to true, and you get:
    // the template for each item in a node's array of item data
    var itemTempl =
      $(go.Panel, "TableColumn",
        { stretch: go.GraphObject.Horizontal },
        $(go.Shape,
          { row: 0, alignment: go.Spot.Bottom, stretch: go.GraphObject.Horizontal },
          { fill: "slateblue", stroke: null },
          new go.Binding("height", "val"),
          new go.Binding("fill", "color")),
        $(go.TextBlock,
          { row: 1, stretch: go.GraphObject.Horizontal, textAlign: "center" },
          new go.Binding("text")),
        {
          toolTip:
            $(go.Adornment, "Auto",
              $(go.Shape, { fill: "#EFEFCC" }),
              $(go.TextBlock, { margin: 4 },
                new go.Binding("text", "val"))
            )
        }
      );

    myDiagram.nodeTemplate =
      $(go.Node, "Auto",
        { resizable: true },  // OPTIONAL !
        $(go.Shape,
          { fill: "white" }),
        $(go.Panel, "Vertical",
          { stretch: go.GraphObject.Horizontal },
          $(go.Panel, "Table",
            { name: "TABLE", margin: 6, itemTemplate: itemTempl, stretch: go.GraphObject.Horizontal },
            new go.Binding("itemArray", "items")),
          $(go.TextBlock,
            { font: "bold 12pt sans-serif" },
            new go.Binding("text"))
        )
      );
The result is:

where I have manually resized and moved each node. Of course you don’t need to make those nodes resizable by the user if you don’t want to.