I have built a Gantt chart using your tool which works great!
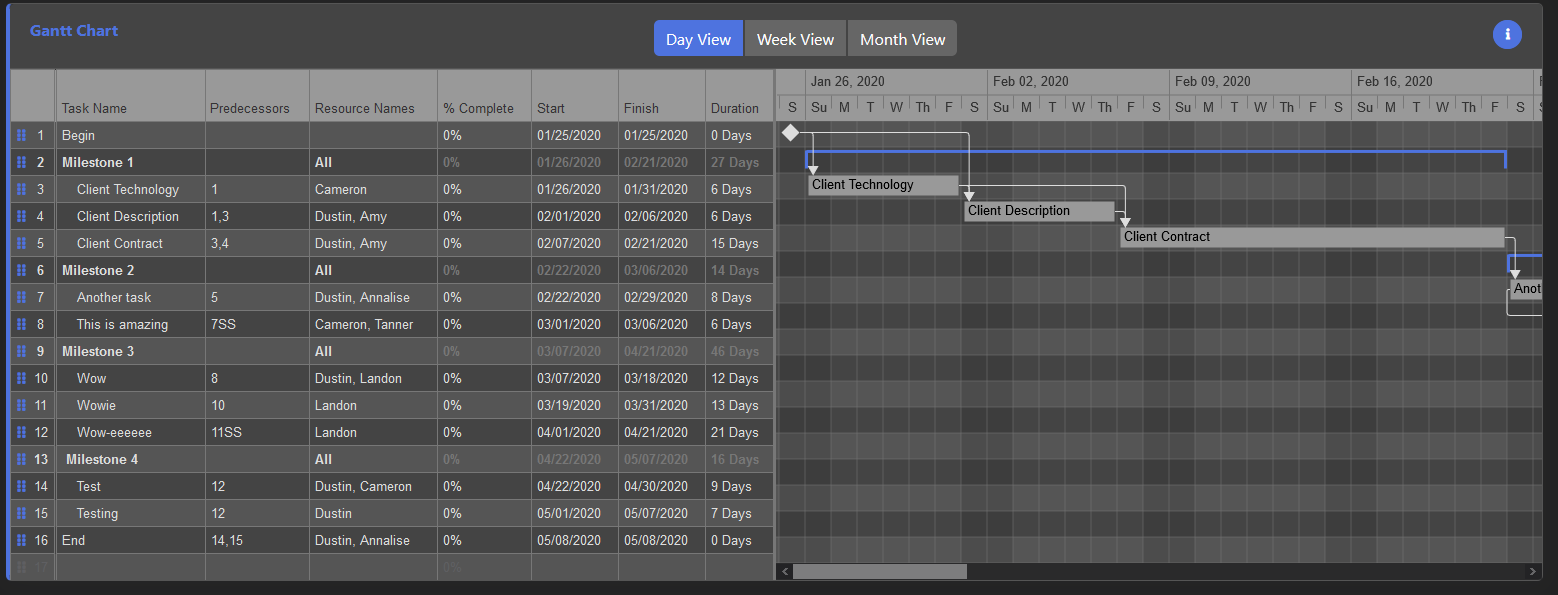
I am using an HTML table next to the chart which updates the chart when values are changed in the table. The problem I am having is getting the cell height to match the table height. It works great until I either zoom in or out, use a different browser, or use a different screen resolution. Below is an example of the wrong image (notice the mismatched row lines):
I have tried using px, em, and rem with the table height. Any ideas on what I need to do to get the table row height to match the canvas cell height across browsers, screen resolutions, and zoom levels.
“px” units should work. I just tried it, setting the width and height of an HTML DIV element adjacent to the Diagram’s DIV, and also creating a Node that was exactly the same width and height. Positioning them next to each other showed that they were the same size, even after scrolling or zooming the page.
Of course scrolling or zooming the diagram would cause the node to appear at a different size and position, but I assume that is not what you are concerned about. Absolute positioning within the viewport is a sample Diagram that doesn’t allow scrolling or zooming.
Hmm. I can’t figure out why it isn’t working then. Have you tried it and it successfully worked in other browsers too? My td’s have 5px padding and I have a 1px border on the top only. Does yours still work in these scenarios?
Okay, I had the height an width set to 26 and I increased it to 28 for both the table and the gantt chart. This resolved the issue. I wonder if the size I had was too small for the content and that is why it ran into issues. Thanks for your help.