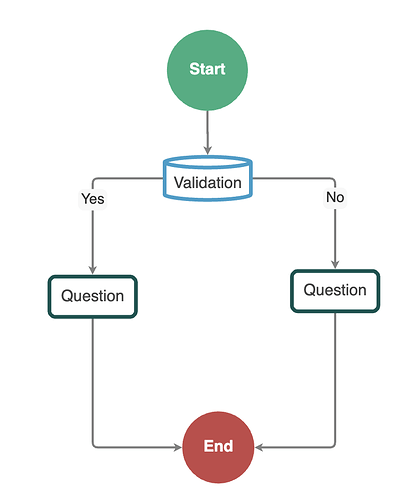
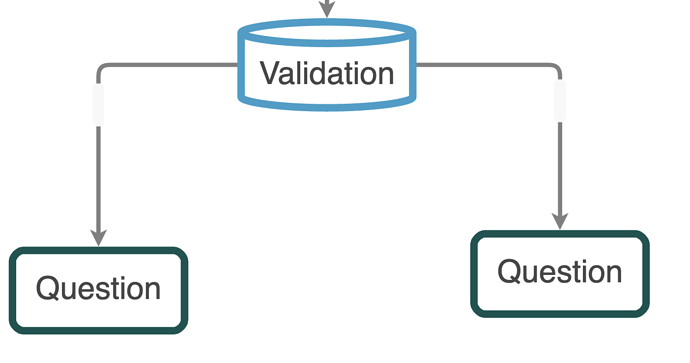
In a flowchart, I have a validation figure that works as a conditional. The idea is to have a label of “Yes” and “No” on the link. Currently, the label appears but always as “Yes”, and I tried editing one of those “Yes” labels to say “No”. When exporting the diagram, I notice that the link’s text property is saved as “No”, but the “Yes” label is not retained. How can I fix this?
and this is the export json:
{ "class": "_GraphLinksModel",
  "linkFromPortIdProperty": "formPort",
  "linkToPortIdProperty": "toPort",
  "nodeDataArray": [
{"category":"Start","text":"Start","question_type_id":"Start","key":-1,"loc":"-116.546875 -430.77734375"},
{"category":"Validation","text":"Validation","question_type_id":"Validation","key":-2,"loc":"-116.30078125 -330.515625"},
{"category":"Question","text":"Question","question_type_id":"Text","key":"-3","loc":"-223.015625 -220.68359375","translate":"rr","bgMedia":"","bgMediaES":"","required":false,"length":""},
{"category":"Question","text":"Question","question_type_id":"Text","key":"-4","loc":"1.97265625 -225.8515625","translate":"rr","bgMedia":"","bgMediaES":"","required":false,"length":""},
{"category":"End","text":"End","question_type_id":"End","key":-5,"loc":"-106.421875 -80.828125"}
],
  "linkDataArray": [
{"from":-1,"to":-2,"formPort":"B","toPort":"T","points":[-116.546875,-393.12609668110696,-116.546875,-383.12609668110696,-116.546875,-372.69586084055345,-116.30078125,-372.69586084055345,-116.30078125,-362.265625,-116.30078125,-352.265625]},
{"from":-2,"to":"-3","formPort":"L","toPort":"T","visible":true,"points":[-158.05078125,-330.515625,-168.05078125,-330.515625,-223.01562499999997,-330.515625,-223.01562499999997,-290.8241834016766,-223.01562499999997,-251.13274180335318,-223.01562499999997,-241.13274180335318]},
{"from":-2,"to":"-4","formPort":"R","toPort":"T","visible":true,"points":[-74.55078125,-330.515625,-64.55078125,-330.515625,1.97265625,-330.515625,1.97265625,-293.4081677766766,1.97265625,-256.30071055335316,1.97265625,-246.30071055335318],"text":"No"},
{"from":"-3","to":-5,"formPort":"B","toPort":"L","points":[-223.01562499999997,-200.23444569664682,-223.01562499999997,-190.23444569664682,-223.01562499999997,-80.828125,-186.46871801864268,-80.828125,-149.92181103728538,-80.828125,-139.92181103728538,-80.828125]},
{"from":"-4","to":-5,"formPort":"B","toPort":"R","points":[1.97265625,-205.40241444664682,1.97265625,-195.40241444664682,1.97265625,-80.828125,-30.474641356357303,-80.828125,-62.921938962714606,-80.828125,-72.9219389627146,-80.828125]}
]}
Here is the link template
        diagram.linkTemplate = $(
          Link,
          {
            routing: Routing.AvoidsNodes,
            curve: Curve.JumpOver,
            corner: 5,
            toShortLength: 4,
            relinkableFrom: true,
            relinkableTo: true,
            reshapable: true,
            resegmentable: true,
            mouseEnter: (e, link: any) =>
              (link.findObject('HIGHLIGHT').stroke = 'rgba(30,144,255,0.2)'),
            mouseLeave: (e, link: any) =>
              (link.findObject('HIGHLIGHT').stroke = 'transparent'),
            selectionAdorned: false
          },
          new Binding('points').makeTwoWay(),
          $(
            Shape, // the highlight shape, normally transparent
            {
              isPanelMain: true,
              strokeWidth: 8,
              stroke: 'transparent',
              name: 'HIGHLIGHT'
            }
          ),
          $(
            Shape, // the link path shape
            { isPanelMain: true, stroke: 'gray', strokeWidth: 2 },
            new Binding('stroke', 'isSelected', (sel) =>
              sel ? 'dodgerblue' : 'gray'
            ).ofObject()
          ),
          $(
            Shape, // the arrowhead
            { toArrow: 'standard', strokeWidth: 0, fill: 'gray' }
          ),
          //descomente si quiere tener label Yes/No en la figura de validacion
          $(
            Panel,
            'Auto', // the link label, normally not visible
            {
              visible: false,
              name: 'LABEL',
              segmentIndex: 2,
              segmentFraction: 0.5
            },
            new Binding('visible', 'visible').makeTwoWay(),
            $(
              Shape,
              'RoundedRectangle', // the label shape
              { fill: '#F8F8F8', strokeWidth: 0 }
            ),
            $(
              TextBlock,
              'Yes', // the label
              {
                textAlign: 'center',
                font: '10pt helvetica, arial, sans-serif',
                stroke: '#333333',
                editable: true
              },
              new Binding('text').makeTwoWay()
            ),
          )
        );
and here the dataModel:
 const dataModel = [
    {
      category: "Start",
      text: "Start",
      question_type_id: "Start",
    },
    {
      category: "Question",
      text: "Question",
      question_type_id: "",
    },
    {
      category: "Validation",
      text: "Validation",
      question_type_id: "Validation",
    },
  ];
finally the validation figure:
        diagram.nodeTemplateMap.add(
          'Validation',
          $(
            Node,
            'Table',
            nodeStyle(),
            $(
              Panel,
              'Auto',
              $(
                Shape,
                'Cylinder1',
                {
                  desiredSize: new Size(80, 40),
                  fill: '#FFF',
                  stroke: '#2F9ECA',
                  strokeWidth: 3.5
                },
                new Binding('figure', 'figure')
              ),
              $(
                TextBlock,
                textStyleRegular(),
                {
                  margin: 8,
                  wrap: TextBlock.WrapFit,
                  editable: true
                },
                new Binding('text').makeTwoWay()
              )
            ),
            makePort('T', Spot.Top, Spot.MiddleTop, true, true),
            makePort('L', Spot.Left, Spot.MiddleLeft, true, true),
            makePort('R', Spot.Right, Spot.MiddleRight, true, true),
          )
        );```
