Creating a linear approximation of a curve

As you can see in the screenshot, I have a rough mockup of what I want. On the left is a GoJS Link, in the form of a bezier curve that can be adjusted at the handles and a control point. On the right is a rough mockup of a linear approximation of that curve.

I imagine I would need to access several points on this curve, and draw lines between them, but I’m not sure how to get those points. The GoJS Link only seems to track the starting and endpoint, as well as the control point. Is there any way to access any points on the curve?

I’m assuming you are only interested in the case involved a cubic Bezier curve.

This is from our internal code. It’s TypeScript, but if you need JavaScript, you can convert it.

/**
* Return a bunch of line segments describing the bezier curve
* @param {number} sx
* @param {number} sy
* @param {number} c1x
* @param {number} c1y
* @param {number} c2x
* @param {number} c2y
* @param {number} ex
* @param {number} ey
* @param {number} epsilon
* @param {Array.<number>} result an Array that holds line segments, alternating X and Y, roughly describing the bezier.
* @return {Array.<number>}
*/
function bezierLines(sx: number, sy: number, c1x: number, c1y: number, c2x: number, c2y: number,
                     ex: number, ey: number, epsilon: number, result: Array<number>): Array<number> {
  if (!lineContainsPoint(sx, sy, ex, ey, epsilon, c1x, c1y) ||
      !lineContainsPoint(sx, sy, ex, ey, epsilon, c2x, c2y)) {
    const a1x = (sx + c1x) / 2;
    const a1y = (sy + c1y) / 2;
    const a2x = (c1x + c2x) / 2;
    const a2y = (c1y + c2y) / 2;
    const a3x = (c2x + ex) / 2;
    const a3y = (c2y + ey) / 2;

    const vx = (a1x + a2x) / 2;
    const vy = (a1y + a2y) / 2;
    const wx = (a2x + a3x) / 2;
    const wy = (a2y + a3y) / 2;
    const mx = (vx + wx) / 2;
    const my = (vy + wy) / 2;

    bezierLines(sx, sy, a1x, a1y, vx, vy, mx, my, epsilon, result);
    bezierLines(mx, my, wx, wy, a3x, a3y, ex, ey, epsilon, result);
  } else {
    if (result.length === 0) { result.push(sx); result.push(sy); }
    result.push(ex); result.push(ey);
  }
  return result;
}

 /**
 * See if P is near the line A - B.
 * @param {number} ax
 * @param {number} ay
 * @param {number} bx
 * @param {number} by
 * @param {number} fuzz A double describing the resolution, with a minimum of 0.000001.
 * @param {number} px
 * @param {number} py
 * @return {boolean}
 */
  function lineContainsPoint(ax: number, ay: number, bx: number, by: number, fuzz: number, px: number, py: number): boolean {
    if (fuzz <= 0) fuzz = 0.000001;
    let maxx = 0.0;
    let minx = 0.0;
    let maxy = 0.0;
    let miny = 0.0;
    if (ax < bx) {
      minx = ax;
      maxx = bx;
    } else {
      minx = bx;
      maxx = ax;
    }
    if (ay < by) {
      miny = ay;
      maxy = by;
    } else {
      miny = by;
      maxy = ay;
    }

    if (ax === bx) {
      return (miny <= py && py <= maxy && ax - fuzz <= px && px <= ax + fuzz);
    }
    if (ay === by) {
      return (minx <= px && px <= maxx && ay - fuzz <= py && py <= ay + fuzz);
    }

    const xrangeHigh = maxx + fuzz;
    const xrangeLow = minx - fuzz;
    if ((xrangeLow <= px) && (px <= xrangeHigh)) {

      const yrangeHigh = maxy + fuzz;
      const yrangeLow = miny - fuzz;
      if ((yrangeLow <= py) && (py <= yrangeHigh)) {

        if (xrangeHigh - xrangeLow > yrangeHigh - yrangeLow) {
          if (ax - bx > fuzz || bx - ax > fuzz) {
            const slope = (by - ay) / (bx - ax);
            const guessY = (slope * (px - ax) + ay);

            if ((guessY - fuzz <= py) && (py <= guessY + fuzz)) {
              return true;
            }
          } else {
            return true;
          }
        } else {
          if (ay - by > fuzz || by - ay > fuzz) {
            const slope = (bx - ax) / (by - ay);
            const guessX = (slope * (py - ay) + ax);

            if ((guessX - fuzz <= px) && (px <= guessX + fuzz)) {
              return true;
            }
          } else {
            return true;
          }
        }
      }
    }
    return false;
  }

This is helpful, thanks. I’m using a quadratic bezier curve however (so a curve with two anchor points, and one control point). Is there a version for just one control point, or is this rather easily repurposable? From what I understand, the bezierLines function returns an array of numbers, every two numbers being a point, and I just draw lines between them for the entire array?

/**
* return a bunch of line segments describing the bezier curve
* @param {number} sx
* @param {number} sy
* @param {number} cx
* @param {number} cy
* @param {number} ex
* @param {number} ey
* @param {number} epsilon
* @param {Array.<number>} result an Array that holds line segments, alternating X and Y, roughly describing the bezier.
* @return {Array.<number>}
*/
function quadraticBezierLines(sx: number, sy: number, cx: number, cy: number, ex: number, ey: number, epsilon: number, result: Array<number>): Array<number> {
  if (!lineContainsPoint(sx, sy, ex, ey, epsilon, cx, cy)) {
    const a1x = (sx + cx) / 2;
    const a1y = (sy + cy) / 2;
    const a2x = (cx + ex) / 2;
    const a2y = (cy + ey) / 2;

    const mx = (a1x + a2x) / 2;
    const my = (a1y + a2y) / 2;

    quadraticBezierLines(sx, sy, a1x, a1y, mx, my, epsilon, result);
    quadraticBezierLines(mx, my, a2x, a2y, ex, ey, epsilon, result);
  } else {
    if (result.length === 0) { result.push(sx); result.push(sy); }
    result.push(ex); result.push(ey);
  }
  return result;
}

Hi, when I use that code to generate the points, and then create lines between them, the approximation seems to be pretty off. Changing the fuzz value has no effect on the actual shape of the approximation, it just sub-divides the lines already placed. Any ideas on what’s happening?

<!DOCTYPE html>
<html>
<head>
<title>Approximated curves</title>
<!-- Copyright 1998-2018 by Northwoods Software Corporation. -->
<meta charset="UTF-8">
<script src="go.js"></script>
<script src="../extensions/GeometryReshapingTool.js"></script>
<script id="code">
  function lineContainsPoint(ax, ay, bx, by, fuzz, px, py) {
    if (fuzz <= 0) fuzz = 0.000001;
    var maxx = 0.0;
    var minx = 0.0;
    var maxy = 0.0;
    var miny = 0.0;
    if (ax < bx) {
      minx = ax;
      maxx = bx;
    } else {
      minx = bx;
      maxx = ax;
    }
    if (ay < by) {
      miny = ay;
      maxy = by;
    } else {
      miny = by;
      maxy = ay;
    }

    if (ax === bx) {
      return (miny <= py && py <= maxy && ax - fuzz <= px && px <= ax + fuzz);
    }
    if (ay === by) {
      return (minx <= px && px <= maxx && ay - fuzz <= py && py <= ay + fuzz);
    }

    var xrangeHigh = maxx + fuzz;
    var xrangeLow = minx - fuzz;
    if ((xrangeLow <= px) && (px <= xrangeHigh)) {

      var yrangeHigh = maxy + fuzz;
      var yrangeLow = miny - fuzz;
      if ((yrangeLow <= py) && (py <= yrangeHigh)) {

        if (xrangeHigh - xrangeLow > yrangeHigh - yrangeLow) {
          if (ax - bx > fuzz || bx - ax > fuzz) {
            var slope = (by - ay) / (bx - ax);
            var guessY = (slope * (px - ax) + ay);

            if ((guessY - fuzz <= py) && (py <= guessY + fuzz)) {
              return true;
            }
          } else {
            return true;
          }
        } else {
          if (ay - by > fuzz || by - ay > fuzz) {
            var slope = (bx - ax) / (by - ay);
            var guessX = (slope * (py - ay) + ax);

            if ((guessX - fuzz <= px) && (px <= guessX + fuzz)) {
              return true;
            }
          } else {
            return true;
          }
        }
      }
    }
    return false;
  }

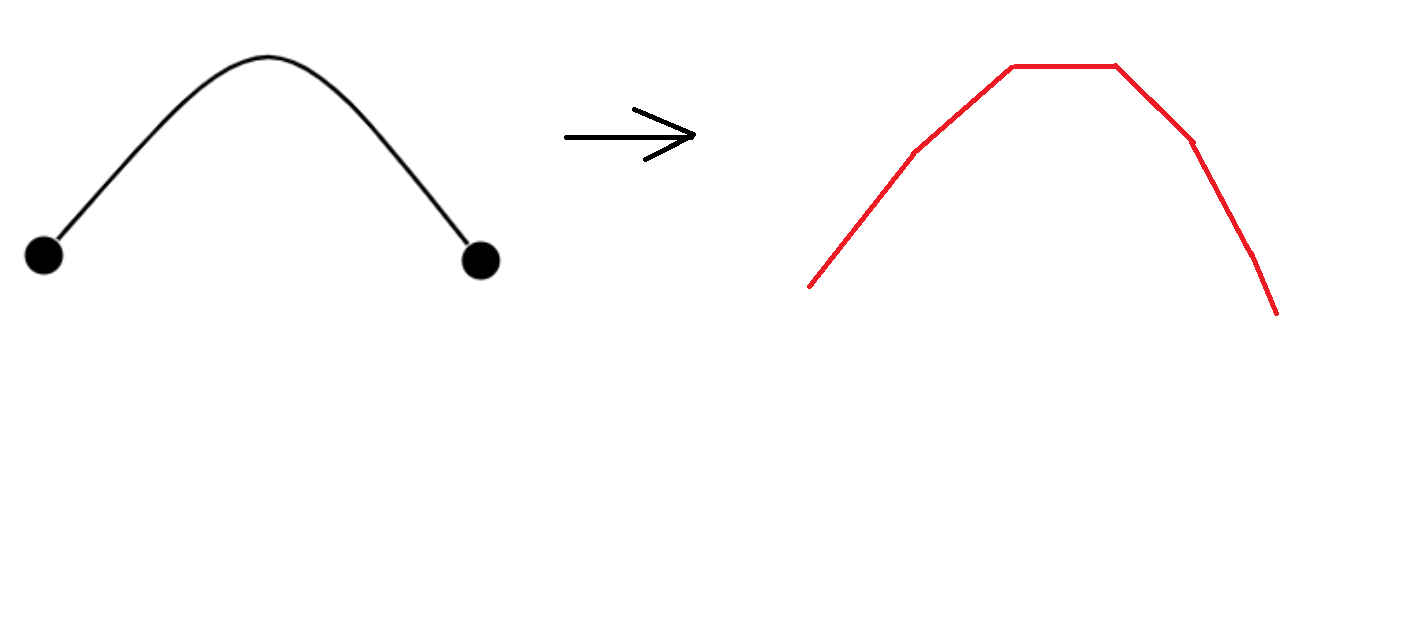
  function cubicBezierLines(sx, sy, c1x, c1y, c2x, c2y, ex, ey, epsilon, result) {
    if (!lineContainsPoint(sx, sy, ex, ey, epsilon, c1x, c1y) ||
        !lineContainsPoint(sx, sy, ex, ey, epsilon, c2x, c2y)) {
      var a1x = (sx + c1x) / 2;
      var a1y = (sy + c1y) / 2;
      var a2x = (c1x + c2x) / 2;
      var a2y = (c1y + c2y) / 2;
      var a3x = (c2x + ex) / 2;
      var a3y = (c2y + ey) / 2;

      var vx = (a1x + a2x) / 2;
      var vy = (a1y + a2y) / 2;
      var wx = (a2x + a3x) / 2;
      var wy = (a2y + a3y) / 2;
      var mx = (vx + wx) / 2;
      var my = (vy + wy) / 2;

      cubicBezierLines(sx, sy, a1x, a1y, vx, vy, mx, my, epsilon, result);
      cubicBezierLines(mx, my, wx, wy, a3x, a3y, ex, ey, epsilon, result);
    } else {
      if (result.length === 0) { result.push(sx); result.push(sy); }
      result.push(ex); result.push(ey);
    }
    return result;
  }

  function quadraticBezierLines(sx, sy, cx, cy, ex, ey, epsilon, result) {
    if (!lineContainsPoint(sx, sy, ex, ey, epsilon, cx, cy)) {
      var a1x = (sx + cx) / 2;
      var a1y = (sy + cy) / 2;
      var a2x = (cx + ex) / 2;
      var a2y = (cy + ey) / 2;

      var mx = (a1x + a2x) / 2;
      var my = (a1y + a2y) / 2;

      quadraticBezierLines(sx, sy, a1x, a1y, mx, my, epsilon, result);
      quadraticBezierLines(mx, my, a2x, a2y, ex, ey, epsilon, result);
    } else {
      if (result.length === 0) { result.push(sx); result.push(sy); }
      result.push(ex); result.push(ey);
    }
    return result;
  }

  function init() {
    var $ = go.GraphObject.make;

    myDiagram = $(go.Diagram, "myDiagramDiv",
      {
        initialContentAlignment: go.Spot.Center,
        initialScale: 2.0,
        "ModelChanged": function(e) {
          if (e.isTransactionFinished) {
            var part = myDiagram.parts.first();
            if (!part) {
              part = $(go.Part,
                { position: new go.Point(0, 0), layerName: "Grid" },
                $(go.Shape, { fill: null, stroke: "red" }));
              myDiagram.add(part);
            }

            var node = myDiagram.nodes.first();
            var fig = node.elt(0).geometry.figures.first();
            var seg = fig.segments.first();
            var lines;
            if (seg.type === go.PathSegment.QuadraticBezier) {
              lines = quadraticBezierLines(fig.startX, fig.startY, seg.point1X, seg.point1Y, seg.endX, seg.endY, 0.5, []);
            } else if (seg.type === go.PathSegment.Bezier) {
              lines = cubicBezierLines(fig.startX, fig.startY, seg.point1X, seg.point1Y, seg.point2X, seg.point2Y, seg.endX, seg.endY, 0.5, []);
            } else {
              return; // only handling first segment being a Bezier curve
            }
            var newfig = new go.PathFigure(lines[0], lines[1], false, false);
            for (var i = 2; i < lines.length; i += 2) {
              newfig.add(new go.PathSegment(go.PathSegment.Line, lines[i], lines[i + 1]));
            }
            part.elt(0).geometry = new go.Geometry().add(newfig);
            part.position = node.position;
          }
        }
      });

    myDiagram.toolManager.mouseDownTools.insertAt(3, new GeometryReshapingTool());
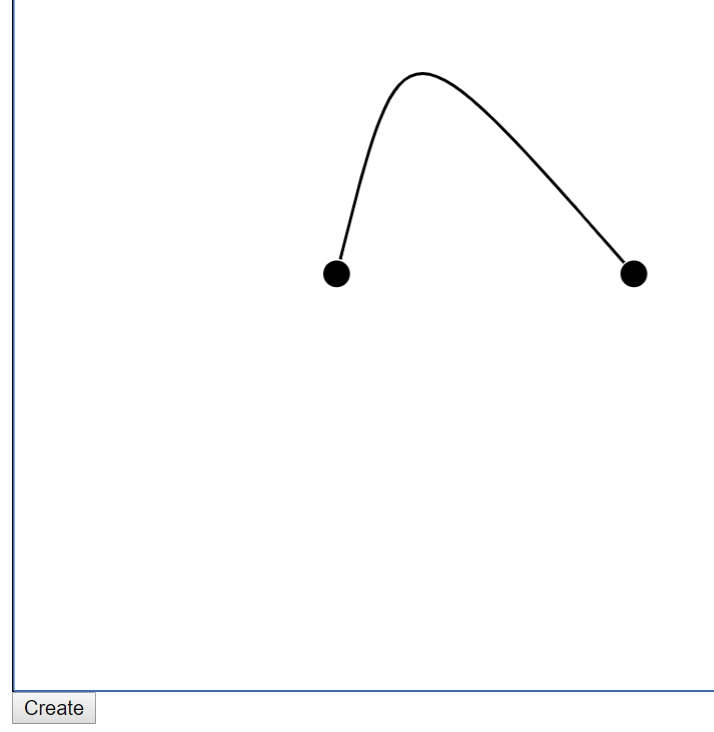
    myDiagram.add(
      $(go.Node,
        { position: new go.Point(0, 0), reshapable: true, selectionAdorned: false },
        $(go.Shape,
          {
            name: "SHAPE",    // needed by GeometryReshapingTool
            fill: "rgba(0,0,0,0.03)",
            geometryString: "F1 M0 0 Q50 50 0 100"
            //geometryString: "F1 M0 0 C50 0 50 100 0 100"
          })
      ));

    myDiagram.select(myDiagram.nodes.first());
  }
</script>
</head>
<body onload="init()">
  <div id="myDiagramDiv" style="border: solid 1px black; width:100%; height:600px"></div>
</body>
</html>