First, I’ll mention that “{ 5, 7 }” is not valid JavaScript.
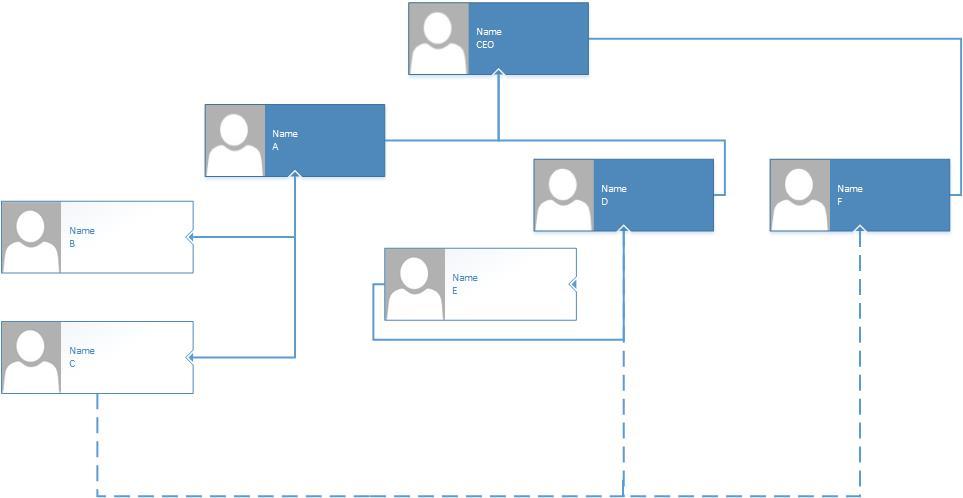
Second, I think that you will find the Org Chart Extras sample, Org Chart Extras, useful. Basically you’ll want to use two different Link templates – one with solid lines that forms a tree structure that can be laid out by TreeLayout, and one with dashed lines with Link.isTreeLink and Link.isLayoutPositioned set to false.
For the TreeLayout, you can play with interactive properties at Tree Layout to learn about how the properties work. But looking at your screenshot it isn’t clear to me exactly what rules you want to use to guide the layout.
Hi, Right :grinning: ,this is a sample data that I got from my friend, isn’t in js.
Thank you very much for the tips and I hope that my problem was resolved.