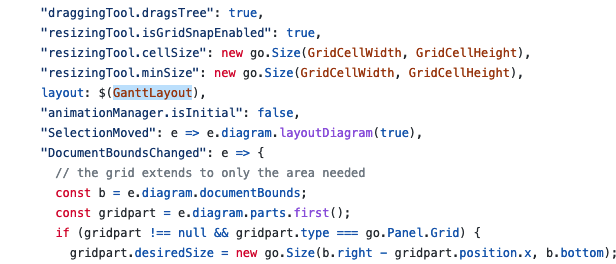
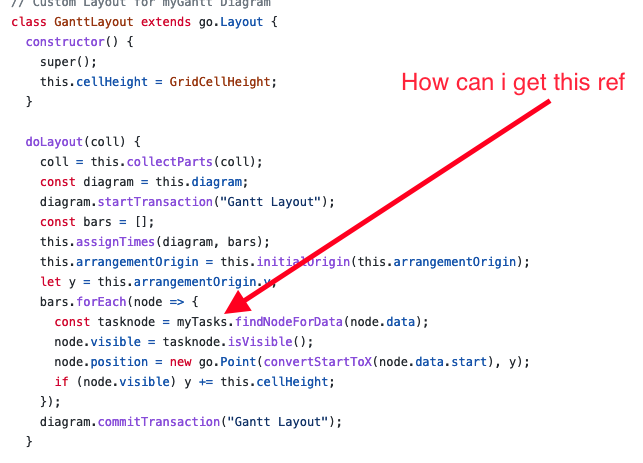
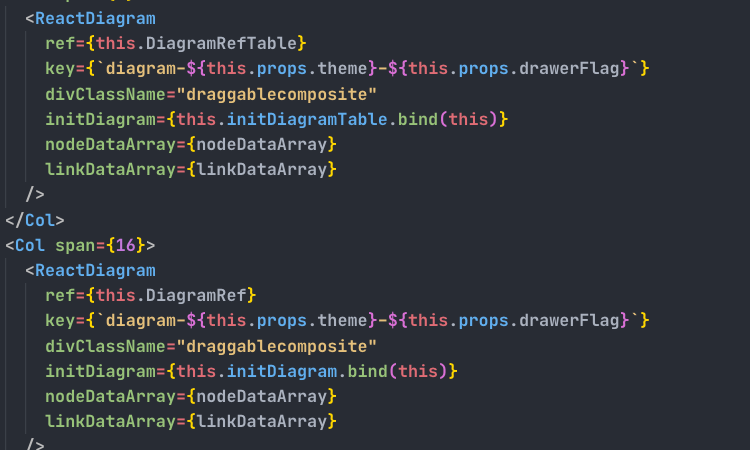
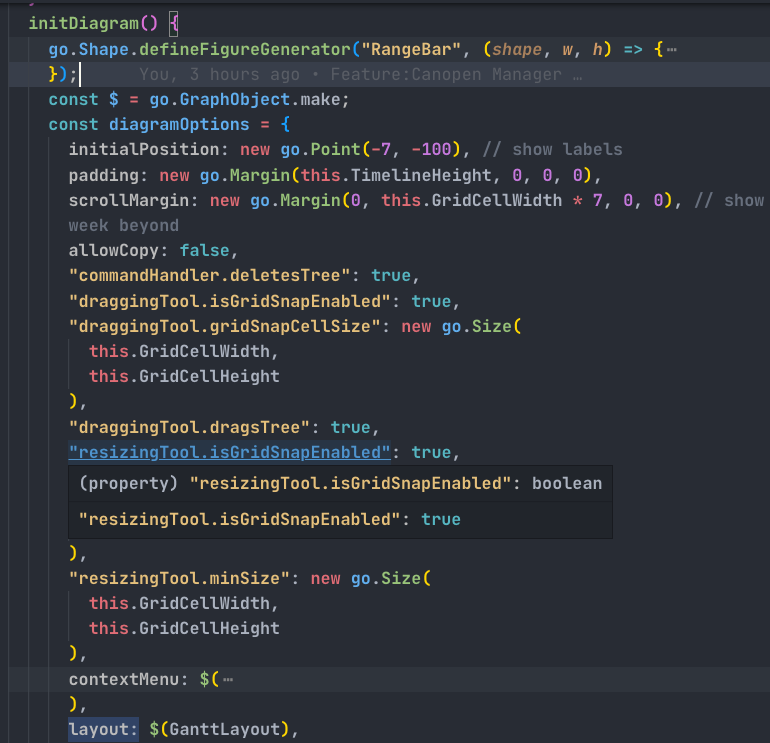
I would like to create gantt chart example with react diagram(Gantt chart) I have created two diagrams but I didnt understand how can I pass mytask diagram reference to gantt layout subclass In your gantt chart you have created const myTasks but my scope is different when I created two different react diagram is there way to pass myTasks ref from $(GanttLayout,…)
I think one way you could do this is to add a property to the GanttLayout which is a go.Diagram.
Then you would set that property in a componentDidMount/useEffect, after both refs are valid. You can get the Diagram from a ref by calling this.myTasksRef.current?.getDiagram();.
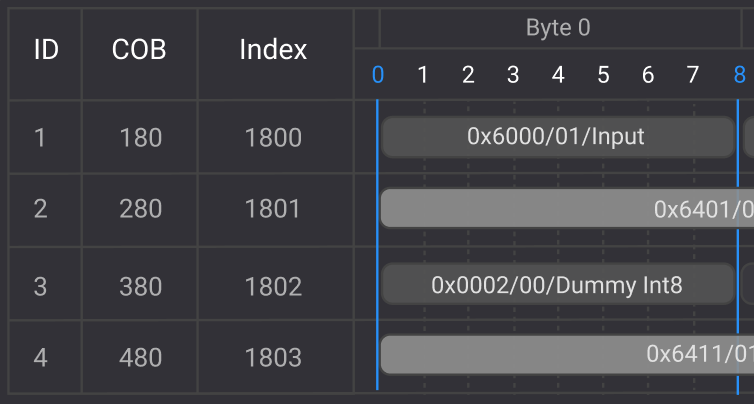
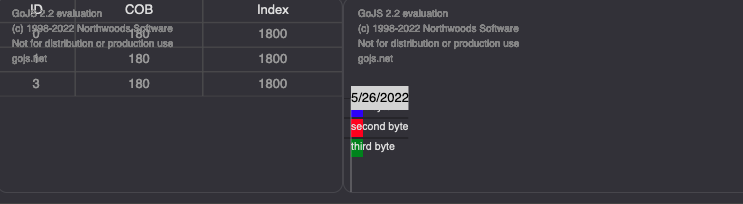
Thank you so much Actually I have another problem I would like convert tree layout to table layout on the left side and hide links I convert table layout but links are visible what should i do hide links I want make table look like second picture
How can i hide the links and give table to full width
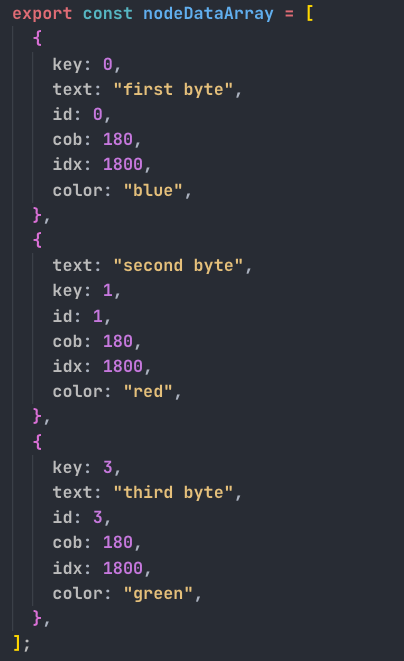
Yes It will come from nodedata but how would set header gridlayout (id cob index) each row has corresponding byte value this will be another challenge Do you have some sample i can make it work thank you
You’ll need to set it up like the Gantt sample I showed earlier. Set the Diagram.padding, Diagram.initialPosition, ViewportBoundsChanged listeners, etc.
Yes I have done that but still have alignment issue, other problem when I do $(go.Link). I do have
“GraphLinksModel.linkKeyProperty must not be an empty string for .mergeLinkDataArray() to succeed.”
should I pass empty array?
That means you have not set the linkKeyProperty in your GraphLinksModel definition. You’ll need to take a closer look at the example I sent earlier and see why yours is different.