Custom geometric shape and table panel

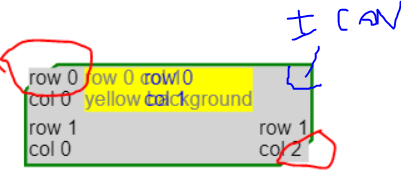
I want to draw a table panel and put it inside a custom shape.
the problem is that the table data is shown outside the shape
image

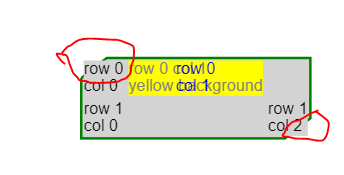
how can I avoid the text getting out of the bounds of the shape?
here is the code for that.

<!DOCTYPE html>
<html>
  <head>
    <title>shape</title>
    <!-- Copyright 1998-2023 by Northwoods Software Corporation. -->
  </head>
  <body>
    <div style="width: 100%; display: flex; justify-content: space-between">
      <div
        style="display: flex; flex-direction: column; margin: 0 2px 0 0"
      ></div>
      <div
        id="myDiagramDiv"
        style="flex-grow: 1; height: 400px; border: solid 1px black"
      ></div>
    </div>
    <div>
      <button id="myLoadButton">Load</button>
      <button id="mySaveButton">Save</button>
    </div>
    <textarea id="mySavedModel" style="width: 100%; height: 200px">
{ "class": "go.GraphLinksModel",
  "nodeDataArray": [
{"key":1, "text":"hello", "color":"green", "location":"0 0"}
  ],
  "linkDataArray": [
{"from":1, "to":2}
  ]}
  </textarea
    >

    <script src="https://unpkg.com/gojs"></script>
    <script id="code">
      const $ = go.GraphObject.make;

      // initialize main Diagram
      const myDiagram = new go.Diagram('myDiagramDiv', {});

      myDiagram.nodeTemplate = $(
        go.Node,
        'Auto',
        $(
          go.Shape,
          {
            fill: 'lightgray',
            geometryString: 'FM 8 5 L 9 4 H 17 V 7 L 16 8 L 8 8 V 5',
            stroke: 'gray',
            strokeWidth: 2,
          },
          new go.Binding('stroke', 'color')
        ),

        $(
          go.Panel,
          'Table',
          $(go.TextBlock, 'row 0\ncol 0', {
            row: 0,
            column: 0,
            margin: 2,
            background: 'lightgray',
          }),
          $(
            go.TextBlock,
            'row 0 col 1\nyellow background',
            // first object in the cell (row: 0, col: 1)
            {
              row: 0,
              column: 1,
              margin: 2,
              background: 'yellow',
              stroke: 'gray',
            }
          ),
          $(
            go.TextBlock,
            'row 0\ncol 1',
            // second object in that cell overlaps the first one,
            // the bigger yellow TextBlock
            {
              row: 0,
              column: 1,
              margin: 2,
              background: 'transparent',
              stroke: 'blue',
            }
          ),
          $(go.TextBlock, 'row 1\ncol 0', {
            row: 1,
            column: 0,
            margin: 2,
            background: 'lightgray',
          }),
          $(go.TextBlock, 'row 1\ncol 2', {
            row: 1,
            column: 2,
            margin: 2,
            background: 'lightgray',
          })
        )
      );

      // save a model to and load a model from Json text, displayed below the Diagram
      function save() {
        const str = myDiagram.model.toJson();
        document.getElementById('mySavedModel').value = str;
      }

      function load() {
        const str = document.getElementById('mySavedModel').value;
        myDiagram.model = go.Model.fromJson(str);
      }
      document.getElementById('myLoadButton').addEventListener('click', load);

      load();
    </script>
  </body>
</html>

Normally one would set Shape.spot1 and spot2 to force the “Auto” Panel to size and position the body of the panel, which in your case is a “Table” Panel, to occupy a particular area within the main element that is your border shape.

I haven’t tried this, but something like:

     spot1: new go.Spot(0.08, 0.05),
     spot2: new go.Spot(0.92, 0.95),

You will need to fiddle with the exact numbers to get the result that you like. The default behavior is to scale the Shape.geometry, so you should not use the Spot.offsetX and offsetY. But you can define your own figure with Shape.defineFigureGenerator, Shape | GoJS API, to have better control of the Geometry and the Shape.spot1 and spot2.

Also you probably want to set the Shape.fill, not the “Table” Panel.background.

I think in my case constant number will not work, because the sample I sent you is just a simple example of the problem
in my case I will probably bind to ArrayItem, so the node size will be different according to the data.

Have you tried it? As I said, by default the geometry will be stretched proportionally, so Spot values without offsetX or offsetY will refer to the same point in the geometry in all cases.

thank you it works perfect

is there a way also to put an icon on the top right of the main shape?
something like this
image

Do you mean like shown in GoJS Nodes -- Northwoods Software ?

Or do you just want to put the icon with alignment: go.Spot.TopRight in the top-right cell of the Table Panel?

thanks it works for me