Customize the dummy vertex in LayeredDigraphLayout

Hi I have two simple diagrams using LayeredDigraphLayout as below.


The default layout does not look perfect and is not consistent in term of the link routing and the vertical position of the end node.

If I understand the LayeredDigraphLayout algorithm correctly, if a link crosses layers, like the link from Box2 to END in the first diagram, a dummy node is created at each crossed layer, like the red box in the diagram below.


I am wondering if there is a way to adjust the size of the dummy nodes so that the layout could be fixed by setting the size of the dummy node same as the real node, as shown below. (Imaging box4 as a dummy node)

Is it possible? Looking forward to hearing from you. Thanks!

Yes, you can control that by overriding an undocumented method:

class CustomLDLayout extends go.LayeredDigraphLayout {
  nodeMinColumnSpace(v, topleft) {
    if (v.node === null && v.data === null) return 2;  // or whatever number of columns you want
    return super.nodeMinColumnSpace(v, topleft);
  }
}

Hi Walter, what you suggested works perfectly with small diagrams. I did see some issue when I made the diagram more complicated.

For example, the following two diagrams look very good. The first diagram has full connections between (Box2, Box3) and (Box4, Box5). And the second diagram has one more extra node (Box6) in one path.


But if I combined them together, I saw some elbow on the link from Box2 to Box4.

I am not really nitpicking here because it is part (in the red dotted line) of a bigger diagram below, which does not look good.

I am posting my JS code below with the custom layout class and node and link templates. Please let me know if there is any fix that I could apply. Thanks so much for your time!

const $ = go.GraphObject.make;

const init = () => {
  class DefactoLayout extends go.LayeredDigraphLayout {
    nodeMinColumnSpace(v, topleft) {
      // the column space is determined by the
      // width and height of the object divided by the #columnSpcacing.
      // here, node height is 100 and the default columSpacing is 25
      if (v.node === null && v.data === null) return 4;
      return super.nodeMinColumnSpace(v, topleft);
    }
  }

  const myDiagram = $(go.Diagram, "myDiagramDiv", {
    layout: $(DefactoLayout, {
      layerSpacing: 100,
      linkSpacing: 20,
      layeringOption: go.LayeredDigraphLayout.LayerLongestPathSource,
    }),
  });

  myDiagram.nodeTemplateMap.add(
    "",
    $(
      go.Node,
      "Spot",
      $(go.Shape, "RoundedRectangle", {
        fill: "white",
        width: 100,
        height: 100,
        portId: "",
      }),
      $(
        go.TextBlock, // the text label
        new go.Binding("text", "key"),
        {
          verticalAlignment: go.Spot.Center,
          textAlign: "center",
        },
      ),
    ),
  );

  myDiagram.linkTemplate = $(
    go.Link, // the whole link panel
    { routing: go.Link.Orthogonal, corner: 16, reshapable: true },
    $(
      go.Shape, // the link shape
      { strokeWidth: 1.5 },
    ),
    $(
      go.Shape, // the arrowhead
      { toArrow: "Standard", stroke: null },
    ),
  );

  const model = new go.GraphLinksModel();
  model.nodeDataArray = nodeDataArray;
  model.linkDataArray = linkDataArray;
  myDiagram.model = model;
};

window.addEventListener("DOMContentLoaded", init);

How have you implemented that nodeMinColumnSpace override?
Have you tried decreasing the number of columns for each dummy vertex when there are more than will fit in the available area, causing them to spread out as I think your screenshots demonstrate?

Hi Walter, I gave it a constant number.

I’m wondering if that might cause some layers with dummy nodes, or adjacent to such layers, to be wider than they should be.

Hi Walter, are you going to investigate it or will you show me how to investigate and fix it?

Sorry, but I do not have time now.

Hi Walter, are you saying that we have to live with it?

I can investigate this issue from my side but I need some hints how to do it. For example, in order to confirm that some dummy nodes are wider than they should be, how to make them visible in the diagram?

Thanks!

We’ll look into the problem. I was just saying that it’s rather busy right now, and I didn’t know when I will have time.

Actually, in reviewing your screenshots, could you make use of the MergingTreeLayout given in Tree layout vertical nodes alignment - #3 by walter ?

Hi Walter, my misunderstanding. Sorry :( Please take your time since it is the holiday season. No rush!

We want to stick with the LayerDigraphLayout because our diagram can be very complicated. We have investigated the ParallelLayout with Split and Merge nodes. But it does not satisfy our use cases. I did not check MergingTreeLayout in details but I got the feeling that it is similar to ParallelLayout as a subclass of TreeLayout as well.

Happy holidays!

As it so happens, we’re working on a new property for version 2.3: LayeredDigraphLayout.alignOption. By setting alignOption: go.LayeredDigraphLayout.AlignAll one gets the following result for the graph that you showed:

No override of the undocumented nodeMinColumnSpace method is needed.

That functionality hasn’t gotten into the 2.3 alpha that is now available – I’d expect it to be present in a release early next year.

Sweet. Looking forward to using this new property :) Thanks so much Walter

Please try 2.3 beta at: GoJS - Build Interactive Diagrams for the Web
It would be nice to receive feedback before we release it as latest.

Hi Walter, I tried the 2.3 beta. One issue I noticed is that when the diagram is too wide to fit into the browser or zoomed in, it can only be scrolled to the left. Is it a known issue? Thanks.

That’s odd. What OS are you using? Are you using a mouse or touches? And is there a specific sample you saw this behavior on, or any sample?

Also, are you sure that the diagram’s whole HTMLDivElement is visible in the browser?

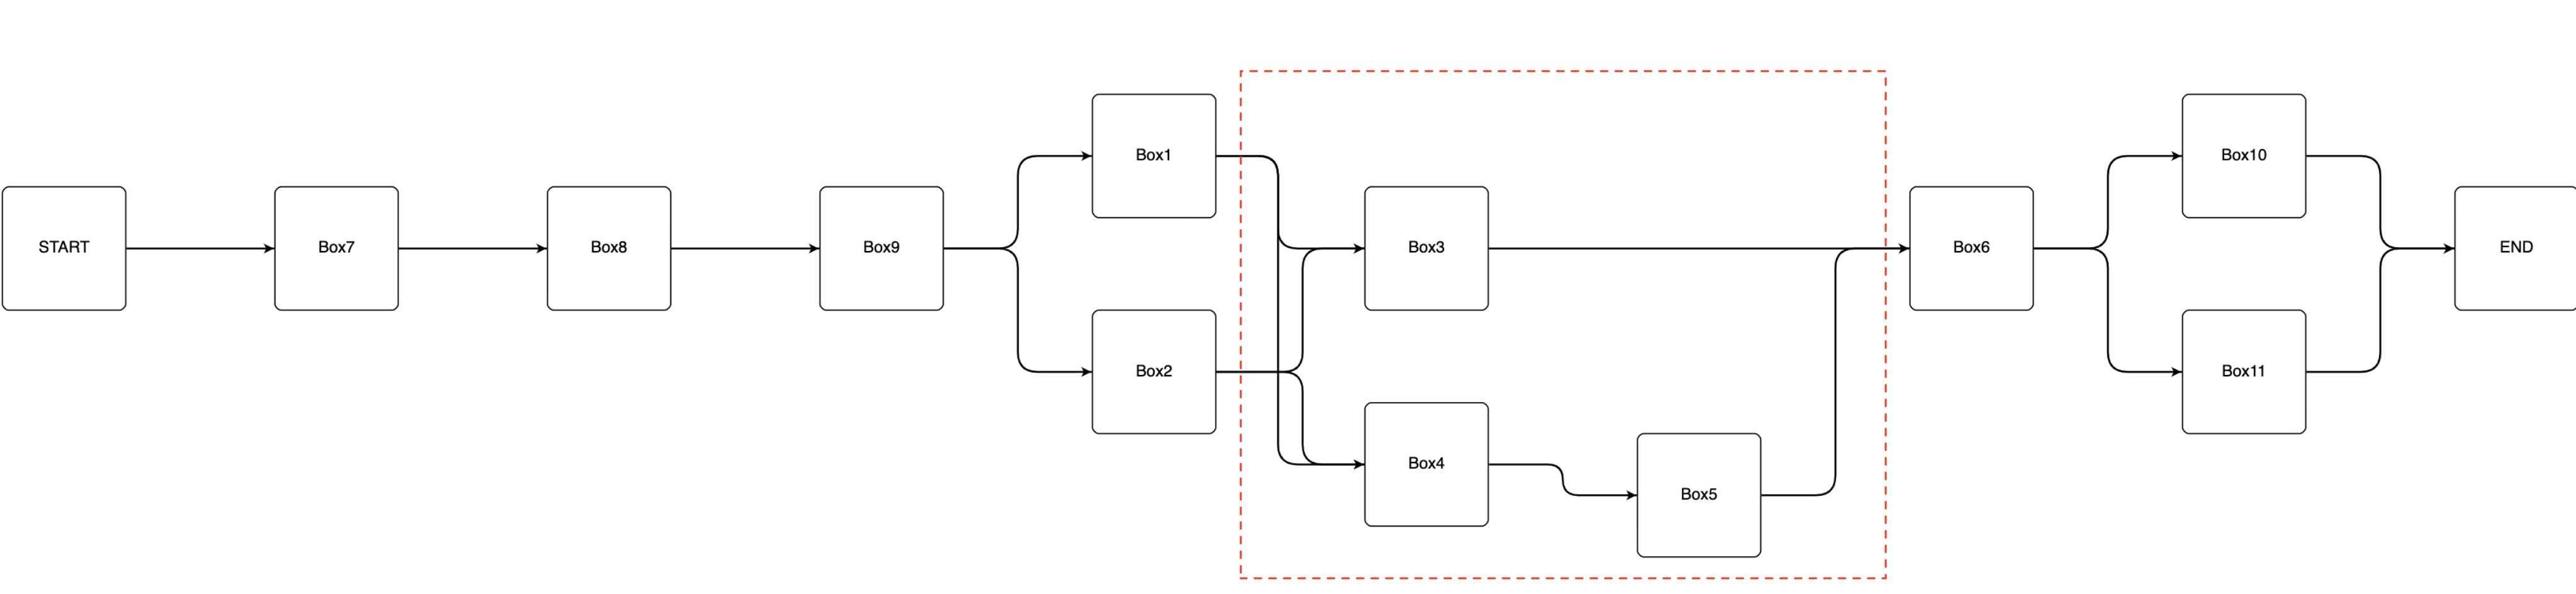
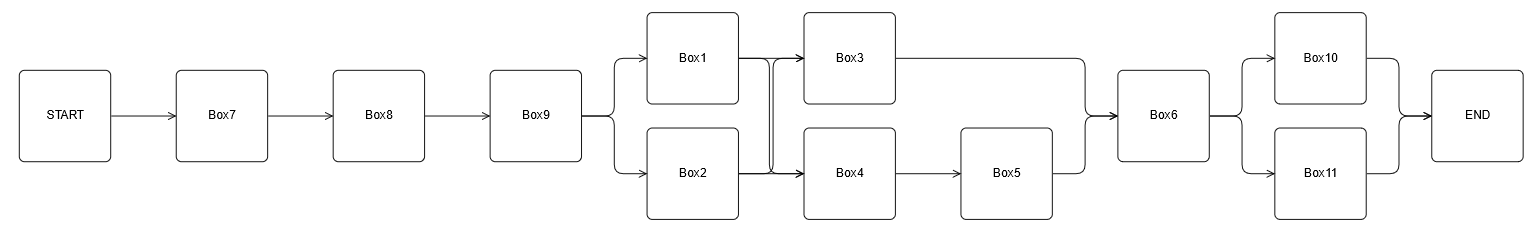
Hi Simon and Walter, I am using macOS Big Sur. I am pasting my HTML + JS code below. If there is any cdn link for 2.3 beta, I could create a JSFiddle or CodePen project to illustrate.

<!DOCTYPE html>
<html lang="en">
  <head>
    <meta charset="UTF-8" />
    <meta http-equiv="X-UA-Compatible" content="IE=edge" />
    <meta name="viewport" content="width=device-width, initial-scale=1.0" />
    <title>Document</title>
  </head>
  <body>
    <div
      id="myDiagramDiv"
      style="border: solid 1px black; width: 100%; height: 700px"
    ></div>
    <script src="../../node_modules/gojs/release/go-debug.js"></script>
    <script>
      const nodeDataArray = [
        {
          key: "START",
        },
        {
          key: "Box1",
        },
        {
          key: "Box2",
        },
        {
          key: "Box3",
        },
        {
          key: "Box4",
        },
        {
          key: "Box5",
        },
        {
          key: "Box6",
        },
        {
          key: "Box7",
        },
        {
          key: "Box8",
        },
        {
          key: "Box9",
        },
        {
          key: "Box10",
        },
        {
          key: "Box11",
        },
        {
          key: "END",
        },
      ];

      const linkDataArray = [
        {
          from: "START",
          to: "Box7",
        },
        {
          from: "Box7",
          to: "Box8",
        },
        {
          from: "Box8",
          to: "Box9",
        },
        {
          from: "Box9",
          to: "Box1",
        },
        {
          from: "Box9",
          to: "Box2",
        },
        {
          from: "Box1",
          to: "Box3",
        },
        {
          from: "Box1",
          to: "Box4",
        },
        {
          from: "Box2",
          to: "Box4",
        },
        {
          from: "Box2",
          to: "Box3",
        },
        {
          from: "Box4",
          to: "Box5",
        },
        {
          from: "Box3",
          to: "Box6",
        },
        {
          from: "Box5",
          to: "Box6",
        },
        {
          from: "Box6",
          to: "Box10",
        },
        {
          from: "Box6",
          to: "Box11",
        },
        {
          from: "Box10",
          to: "END",
        },
        {
          from: "Box11",
          to: "END",
        },
      ];

      const $ = go.GraphObject.make;

      const init = () => {
        const myDiagram = $(go.Diagram, "myDiagramDiv", {
          layout: $(go.LayeredDigraphLayout, {
            layerSpacing: 100,
            linkSpacing: 20,
            layeringOption: go.LayeredDigraphLayout.LayerLongestPathSource,
            alignOption: go.LayeredDigraphLayout.AlignAll,
          }),
        });

        myDiagram.nodeTemplateMap.add(
          "",
          $(
            go.Node,
            "Spot",
            $(go.Shape, "RoundedRectangle", {
              fill: "white",
              width: 100,
              height: 100,
              portId: "",
            }),
            $(
              go.TextBlock, // the text label
              new go.Binding("text", "key"),
              {
                verticalAlignment: go.Spot.Center,
                textAlign: "center",
              },
            ),
          ),
        );

        myDiagram.linkTemplate = $(
          go.Link, // the whole link panel
          { routing: go.Link.Orthogonal, corner: 16, reshapable: true },
          $(
            go.Shape, // the link shape
            { strokeWidth: 1.5 },
          ),
          $(
            go.Shape, // the arrowhead
            { toArrow: "Standard", stroke: null },
          ),
        );

        const model = new go.GraphLinksModel();
        model.nodeDataArray = nodeDataArray;
        model.linkDataArray = linkDataArray;
        myDiagram.model = model;
      };

      window.addEventListener("DOMContentLoaded", init);
    </script>
  </body>
</html>

The scrolling issue is with the touchpad. If I use mouse to drag the thumb of the scrollbar, it works.

I take it back. The mouse dragging is also weird. I need to find certain “sweet spot” to drag…