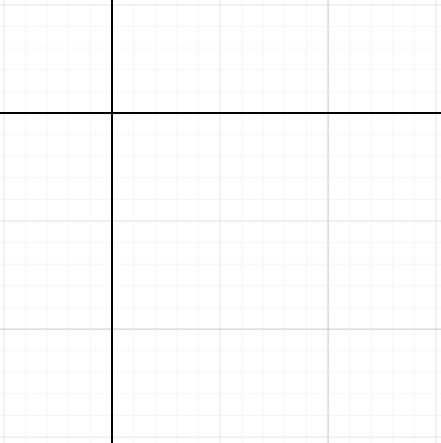
Hi, I want to highlight the origin of the diagram by drawing a thicker line in the grid at the lines (x, 0) and (0, y).
Using the diagram.grid I encountered the problem of generating only a single vertical/horizontal line.
Setting the interval extremly large (e.g. Number.MAX_SAFE_INTEGER) creates performance problems, so I used a largish value.
Basically I want this:
Which I realized like this:
        diagram.grid.add(
            $go(go.Shape, "LineH", { strokeWidth: 5, interval: 100000 }),
            $go(go.Shape, "LineV", { strokeWidth: 5, interval: 100000 })
        );
Is there a better way without using some large values for interval?