Diagram Rendering takes a lot of time owing to huge nodeDataArray and LinkDataArray

Hi,
I have a huge linkDatatArray (at least 2000 links including the tree node-child links) and NodeDataArray (atleast 500 nodes). As a result after new go.GraphLinksModel(nodeDataArray, linkDataArray), the diagram rendering is taking a lot of time owing to huge data. Is there any way of incremental loading of diagram so that entire loading thing can be smooth?

Also, We want to put a loading indicator on the diagram during the diagram loading. Do we have anything of that sort in GoJS?

Read more about these issues at GoJS Performance Considerations -- Northwoods Software

For the size diagram that you talk about, 500 nodes and 2000 links, there should only be a problem if you are using LayeredDigraphLayout. If you are, that would not be a problem if we were using Java or .NET, but alas we have to use JavaScript when running in the browser. Are you using LayeredDigraphLayout? If so, how is your layout declared?

No where we are using LayeredDigraphLayout. We are using only TreeLayout.

var layout =  $(go.TreeLayout, {
                                    alignment: go.TreeLayout.AlignmentStart,
                                    angle: 0,
                                    compaction: go.TreeLayout.CompactionNone,
                                    layerSpacing: 0.8,
                                    layerSpacingParentOverlap: 1,
                                    nodeIndent: 2,
                                    nodeIndentPastParent: 0.99,
                                    nodeSpacing: 0,
                                    setsPortSpot: false,
                                    setsChildPortSpot: false
                                })

500 nodes should not be a problem. For example, GoJS Tree View has 500 nodes.

But note that your example of 500 nodes and 2000 links cannot be tree-structured.

How long do you consider a “lot of time”?

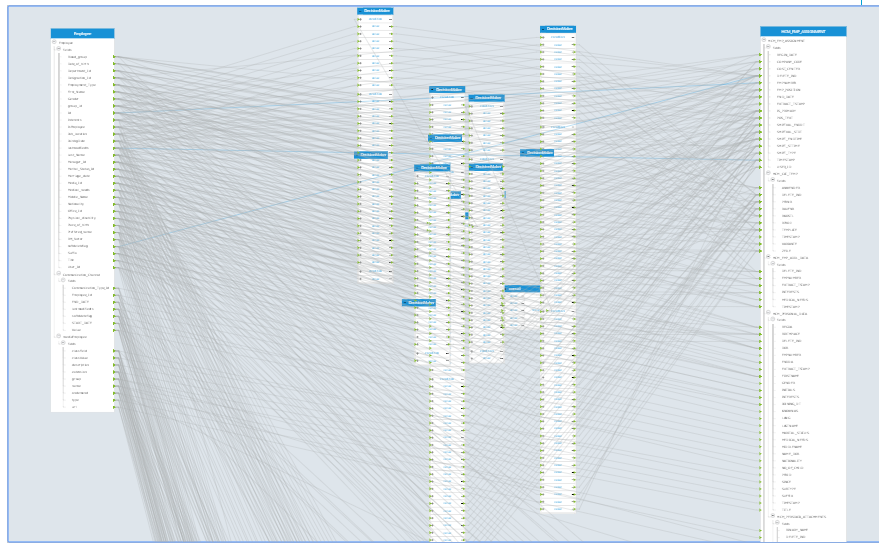
The diagram rendering takes 10-15 seconds. To give you relative picture, a diagram with two groups having tree structure and not more than 50 nodes and 100 links renders in a second or two. I am attaching a picture of the diagram to highlight how big it can get to take 10-15 seconds to render.

So is there a neater smoother way of diagram rendering? Also, is any diagram loading indicator available during the rendering?

You’ve read the Introduction page on Performance, so you know about some of the alternatives.

Unrelated to load time, but it seems to me that you would want to start off with the groups collapsed, just to keep the diagram simpler to understand.

Disabling the animation has made the diagram rendering a little faster. However, I am facing one issue after disabling the animation
Diagram.animationManager.isEnabled = false;

As you can see in the picture, sometimes the diagram just doesn’t render. It gets stuck there as shown in picture. Now any change in the diagram (like zoom up down or inspect the element) renders the whole diagram. Any work around for this?

That’s surprising – I’ve never seen that behavior. How do you initialize your Diagram?

Is your Diagram in a tab? You may need to call myDiagram.requestUpdate() once you’re certain that the Div which contains the diagram has finished resizing (which may mean, the first time a tab has been activated).

For example see:

http://gojs.net/latest/intro/resizing.html

Simon/Walter,
Yes, the Diagram is in a tab. I will try with your solution, and update the thread.
Thanks.

Hi Walter/Simon,
I tried this: myDiagram.delayInitialization( function() { myDiagram.requestUpdate(); } );

It didn’t work.

Then I put the requestUpdate method inside the setTimeout:

setTimeout(function() {
diagram.requestUpdate();
}, 2000);

Worked for me.

Thanks a lot!

FYI, Diagram.delayInitialization just causes “initialization” events of a Diagram (that one would normally get after replacing its Diagram.model) to happen again after updating the diagram.