Hi, we are using GOJS for our requirement of UI visualization. We have a use case where there are close to 10 thousand nodes and 10 thousand links which we need to display. Once we load the data to GOJS library and load it on the browser, the overall experience becomes slow. Precisely, while expanding sub graphs (we have nested graph structure) we see it takes a lot of time to expand and minimize specifically.
Could you please help us with any pointers to solve this?
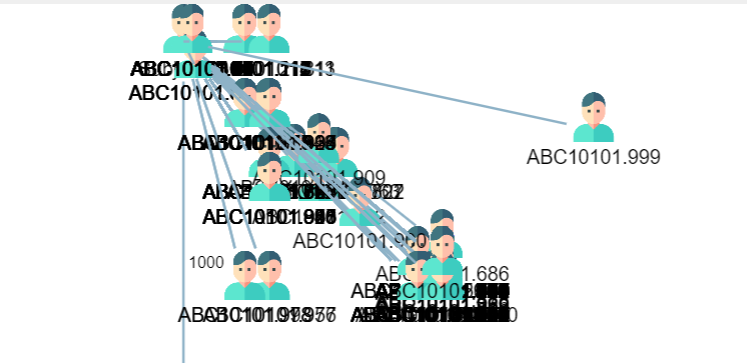
@walter, Page becomes unresponsive. The time to render 1000 nodes and links is like 3min. Way much higher than expected, expecting to be in seconds atleast.
In the example the maxIterations are like 250, if I reduced it to 0, it is taking only 8sec but the graph looks pathetic. Any solution?
I’ll try some experiments. Could you share that model with us? You can strip out any proprietary or personal data properties.
Also, you could try fiddling with the parameters of the layouts in the RadialForceDirectedLayout implementation. For example, try increasing the RadialLayout.layerThickness.
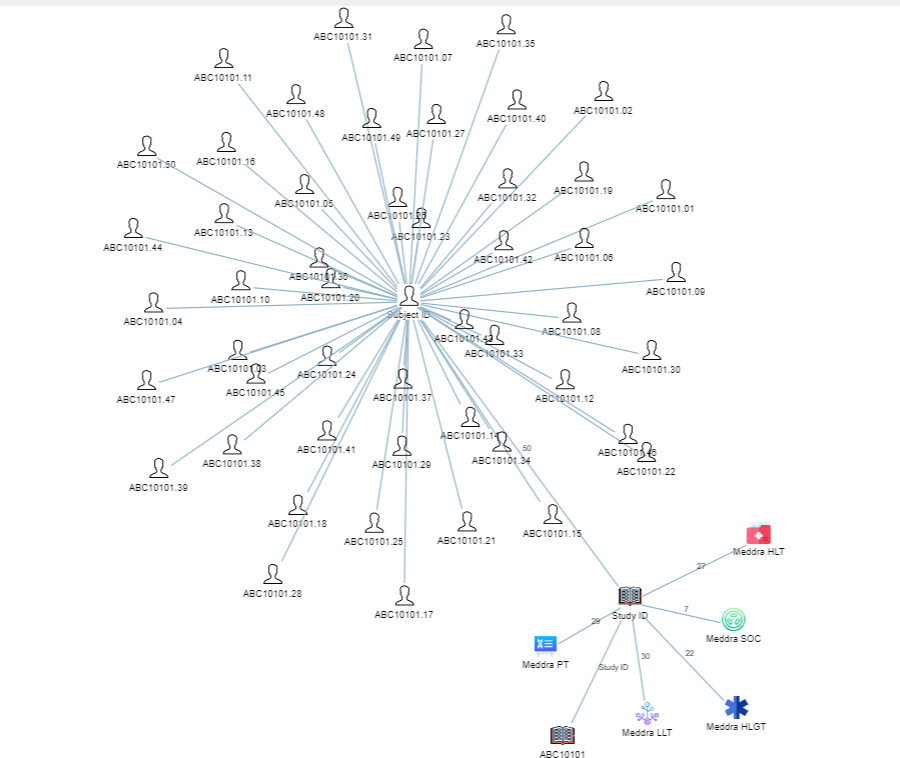
RadialLayout, like CircularLayout, doesn’t work well when there are a lot of nodes “in the same circle”. The nodes really need to be spread out more, not put into a circle. And that’s what happens when there are cases where a node has a thousand links/nodes connecting with it.
So I tried just using the standard ForceDirectedLayout. I found that with 10000 nodes and 9999 links in a broad tree structure (i.e. some nodes having a lot of children), that initial load times were between 15 seconds and 45 seconds, depending on the nature of the graph.
Here’s my code:
<!DOCTYPE html>
<html>
<head>
  <title>Radial & ForceDirected Layout</title>
  <!-- Copyright 1998-2022 by Northwoods Software Corporation. -->
  <meta name="description" content="a ForceDirectedLayout that starts the nodes in a radial-layout fashion">
  <meta name="viewport" content="width=device-width, initial-scale=1">
</head>
<body>
  <div id="myDiagramDiv" style="border: solid 1px black; width:100%; height:600px"></div>
  <span id="myStatus"></span>

  <script src="../release/go.js"></script>
  <script id="code">
const $ = go.GraphObject.make;
const Before = Date.now();

myDiagram =
  new go.Diagram("myDiagramDiv",
    {
      initialAutoScale: go.Diagram.Uniform,
      layout: $(go.ForceDirectedLayout,
        { defaultSpringLength: 1600, defaultSpringStiffness: 0.01 }),
      "InitialLayoutCompleted": e => {  // on the page show the total time in seconds
        document.getElementById("myStatus").textContent = ((Date.now() - Before)/1000).toString();
      }
    });

myDiagram.nodeTemplate =
  $(go.Node, "Spot",
    { width: 50, height: 50 },
    $(go.Shape, "Circle",
      { fill: "gray", portId: "" },
      new go.Binding("fill")),
    $(go.TextBlock,
      new go.Binding("text", "key"))
  );

// (taken from samples/tLayout.html)
// Creates a random number (between MIN and MAX) of randomly colored nodes.
function generateNodeData(minNodes, maxNodes, minChil, maxChil) {
  var nodeArray = [];
  if (minNodes === undefined || isNaN(minNodes) || minNodes < 1) minNodes = 1;
  if (maxNodes === undefined || isNaN(maxNodes) || maxNodes < minNodes) maxNodes = minNodes;

  // Create a bunch of node data
  var numNodes = Math.floor(Math.random() * (maxNodes - minNodes + 1)) + minNodes;
  for (var i = 0; i < numNodes; i++) {
    nodeArray.push({
      key: i,  // the unique identifier
      // "parent" is set by code below that assigns children
      text: i.toString(),  // some text to be shown by the node template
      fill: go.Brush.randomColor(),  // a color to be shown by the node template
    });
  }

  // Randomize the node data
  for (i = 0; i < nodeArray.length; i++) {
    var swap = Math.floor(Math.random() * nodeArray.length);
    var temp = nodeArray[swap];
    nodeArray[swap] = nodeArray[i];
    nodeArray[i] = temp;
  }

  // Takes the random collection of node data and creates a random tree with them.
  // Respects the minimum and maximum number of links from each node.
  // The minimum can be disregarded if we run out of nodes to link to.
  if (nodeArray.length > 1) {
    if (minChil === undefined || isNaN(minChil) || minChil < 0) minChil = 0;
    if (maxChil === undefined || isNaN(maxChil) || maxChil < minChil) maxChil = minChil;

    // keep the Set of node data that do not yet have a parent
    var available = new go.Set();
    available.addAll(nodeArray);
    for (var i = 0; i < nodeArray.length; i++) {
      var parent = nodeArray[i];
      available.remove(parent);

      // assign some number of node data as children of this parent node data
      var children = Math.floor(Math.random() * (maxChil - minChil + 1)) + minChil;
      for (var j = 0; j < children; j++) {
        var child = available.first();
        if (child === null) break;  // oops, ran out already
        available.remove(child);
        // have the child node data refer to the parent node data by its key
        child.parent = parent.key;
      }
      if (available.count === 0) break;  // nothing left?
    }
  }
  return nodeArray;
}

myDiagram.model = new go.TreeModel(generateNodeData(10000, 10000, 1, 1000));
  </script>
</body>
</html>
I have set “maxIterations” to 1000 and “layerThickness” to 1000, as I have 1000 nodes (just a random guess) I got the graph rendered in 50sec which is not bad but within 50 sec my browsers becomes unresponsive few times.
You have seen the code I used to generate random trees. Could you please share with us either the models or the way of generating the models that you are using?