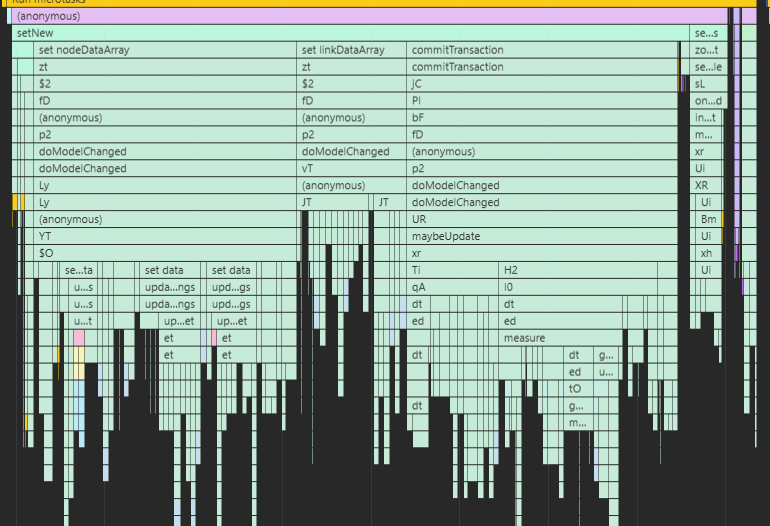
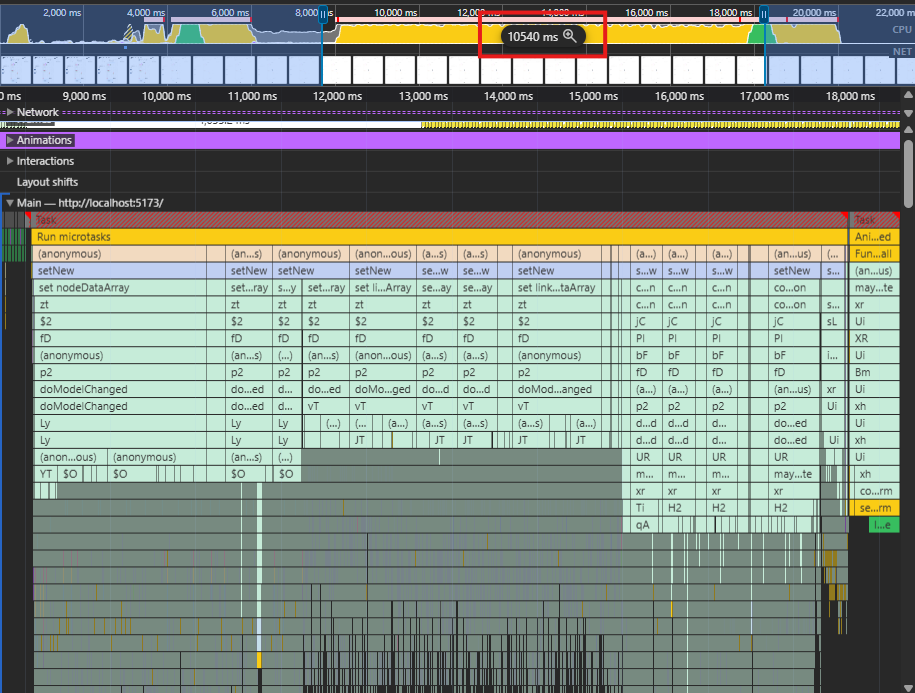
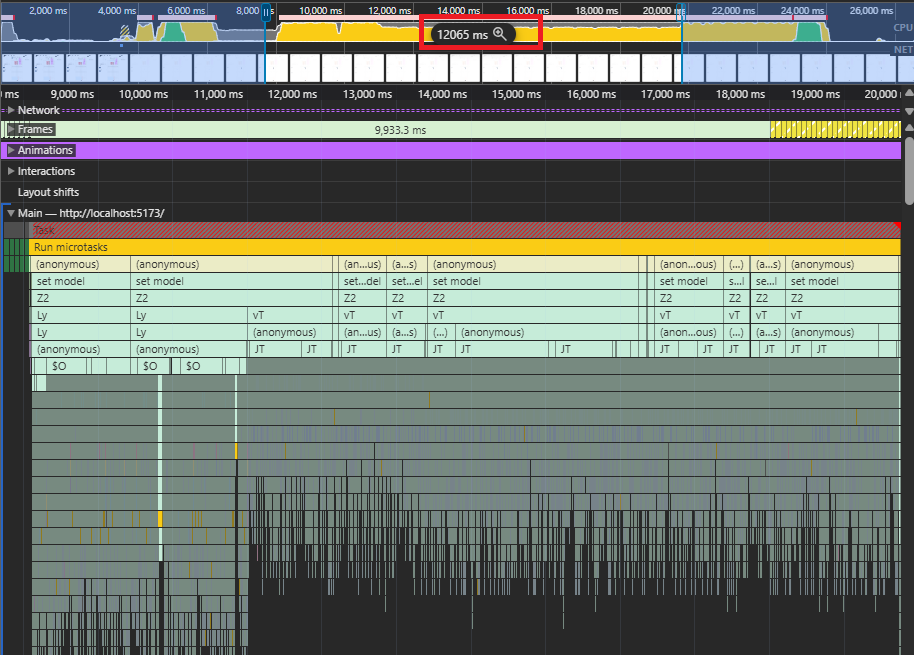
In our application we’re running into performance issues when loading in big nodeDataArray(s) or linkDataArray(s), while diving into the performance tab of google chrome I notice that doModelChanged is called, which takes most of the computing time. But I don’t think this is intended.
This is our diagram.ts, a class that extends the gojs.Diagram
Now the actual question; how can I either disable the modelChanged invocation (I couldn’t find anything in interface) and make sure it’s only done after the ‘setNew’ transaction is committed?
Internally there’s a model Changed listener that notices changes in the model and makes the corresponding changes in the diagram. So when you set the Model.nodeDataArray, it knows to delete all of the old Nodes and create new ones corresponding to the contents of the given Array.
Are you sure that your code is faster than just creating a new model and setting Diagram.model? It will automatically unregister your model Changed listener on the old Model and register it on the new Model, and use a new UndoManager. I don’t know what your _emitHistory and _forceRedrawOverview do, so I don’t know if you still need to call them. You do need to call Diagram.focus, if that is what you want.
_forceRedrawOverview; redraws the (gojs)overview forcefully, which also takes some computing time _emitHistory; emits the gojs diagram transaction history to a pinia store.
I doubt that the code is faster than just creating a new model, I’ll apply that and I’ll let you know.
How big are your models? I’m wondering if there’s some memory re-use happening in your original code. Although it seems too big a time difference to explain that.
If you primarily care about loading time, then you could try virtualization. But it’s significant programming work, and I don’t know what your trade-offs are.
With each release we usually have a number of performance improvements, although the library is mature enough that I’m not sure that dramatic improvements are now possible without greatly restricting the functionality.
I have read that page, yeah. It has guided us a decent amount already.
If anything I think 10 seconds for loading 50 thousand ~ish items is acceptable. But I’ll continue to push forward, because faster and simpler is always better. I think I can achieve this by minimizing the node and link data types (They’re currently considerably big and I’m guessing this is causing the setting of the model / setting of the node/link data array to take the time it requires.)
At this time I’m not interested in virtualization.
if you zoom out in this diagram (for me atleast) the diagram becomes unresponsive and laggy, how could you achieve that zooming is (almost) always performant? Or is that something that isn’t possible?
The size of each data object (i.e. the number of properties it has) probably won’t make much difference in time. Some, since more memory means more time, but not a lot, and perhaps not noticeable.
Simplifying the node templates would help. Avoid unnecessary bindings, and particularly avoid TwoWay Bindings unless needed. Avoid unnecessary Panels.
The virtualized samples are inherently slower when scrolling or zooming, since they need to check for any Parts that they need to instantiate, or maybe destroy if outside of the viewport, each time there’s a “ViewportBoundsChanged” DiagramEvent. But there are other optimizations that are possible.
So I guess you are interested in performance after loading. That’s another reason to avoid virtualization.
Hi, I’d much rather have a 30 second load time with smooth scrolling, zooming and insertion than vice versa.
Please elaborate on “But there are other optimizations that are possible.” so I could implement these.
I’ll also take a look at the (node/link) templates, these are particularly big and filled with two way bindings at the moment that are probably unnecessary.
What strikes me however is selecting a group of nodes and links, say a hundred then moving them to a different location and deselecting them. This takes significantly longer in your 40k example relative to Virtualized Diagram no Layout | GoJS Diagramming Library Is that because if you have more nodes and links in your model / diagram that it impacts that?
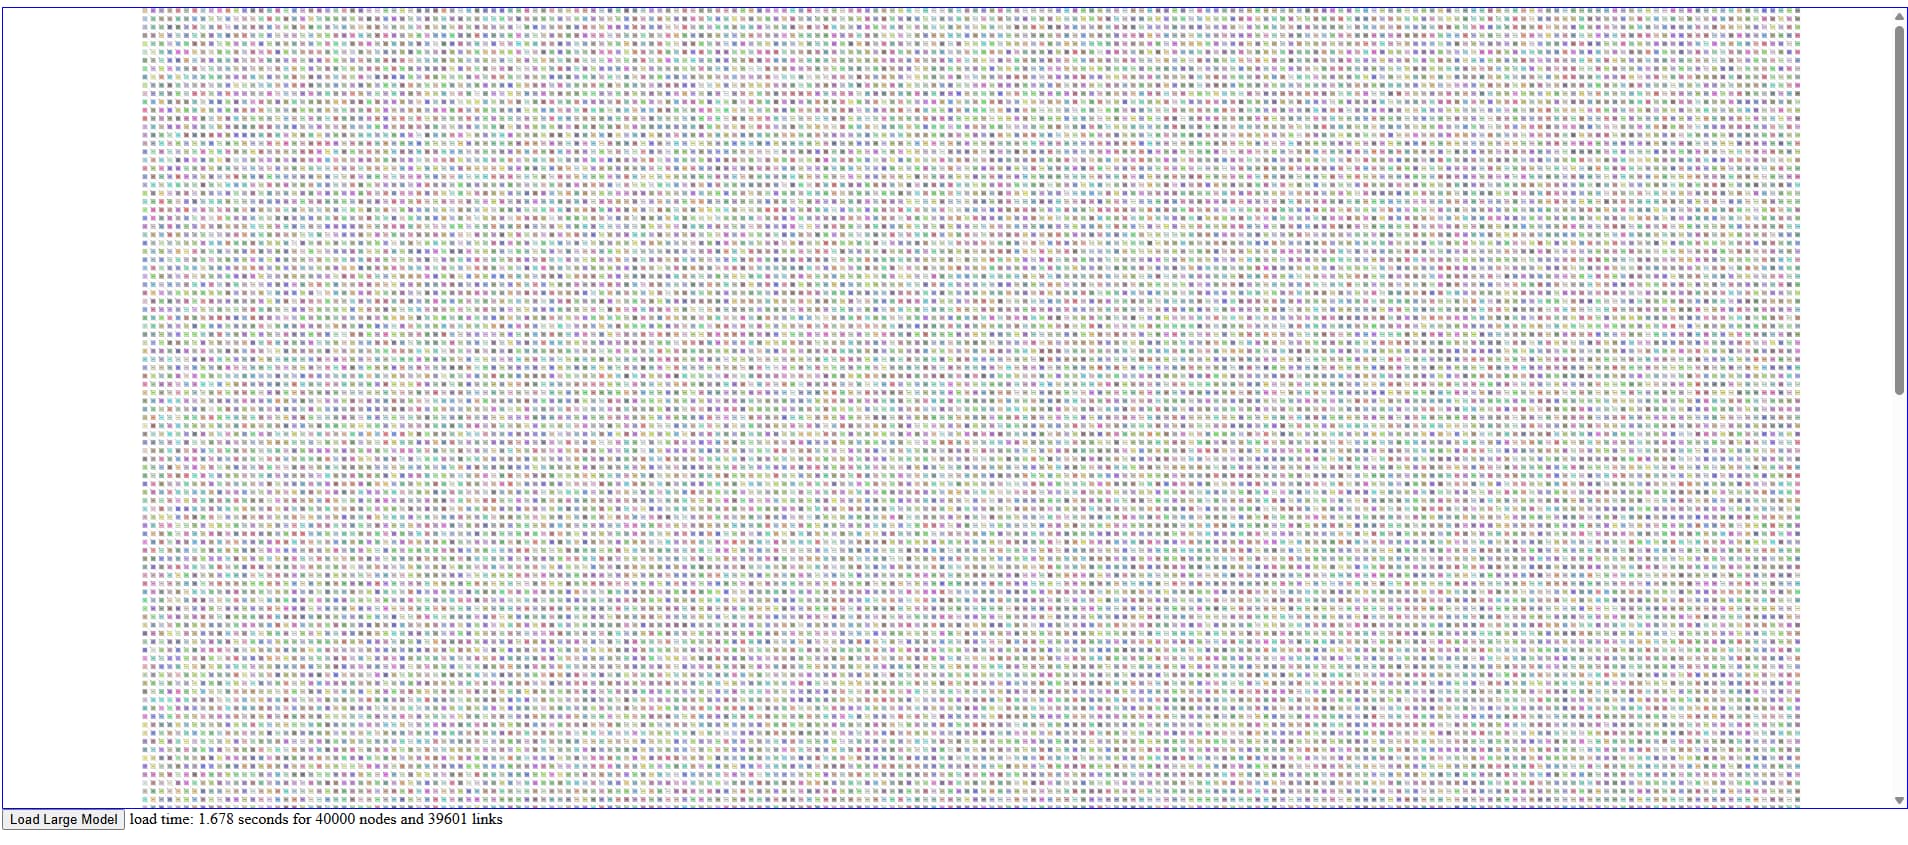
How did you achieve to load in fourty thousand nodes and thirty nine thousand links in ~1,5 seconds?
As you can see in the implementation of that sample (as usual, embedded in the page itself), there was nothing done to improve performance. That’s just how it is.
Well, having very simple nodes helps a lot. You can make the node template more elaborate, perhaps just copying your template into that code, so that you can see what the overhead is from having complex nodes.
That overhead is not only when making copies of nodes, one for each node data object in the model, but also when drawing, especially when there are lots of them visible at the same time. We do have a bunch of internal optimizations to help improve drawing performance, but those all happen automatically.
I see and I’ll look into the templates we have when I can. The only issue I’m facing is that I don’t know how to do it better / more elaborate currently. If I indulge myself more into the documentation of the (node/ link)templates and their best practices.
But you haven’t answered the question;
How did you achieve to load in fourty thousand nodes and thirty nine thousand links in ~1,5 seconds?
We’ve had a lot of experience designing and building interactive diagram libraries, starting in C++ and MFC (GO++), then in Java for Swing and for SWT (JGo), then in .NET for Windows Forms and for ASP.NET (GoDiagram), then for WPF and for Silverlight (GoXam), then in JavaScript for Canvas and for SVG (GoJS), and most recently for .NET again for Windows Forms and for Avalonia (GoDiagram 10+).
Each time we redesigned both the API and the internals to make them better. And of course we have been improving the API and the internals as new releases come out. GoJS v3.0 is noticeably faster than 2.* due to our ability to make use of newer JavaScript and HTML DOM features that we couldn’t before when we were still targeting older browsers (ES 2012). Still, we aren’t changing the API incompatibly very much, even at major releases.
What I sometimes recommend to people is to start with the data model (schema) that you think you’ll need, and start implementing the diagram without any templates at all. Then build up the node template(s) and link template(s) and group template(s), adding the appearances and behaviors that you want. You might want to read Nodes | GoJS
And of course you can copy from the hundreds of samples. Mixing and matching can require more knowledge about the conceptual design, of course, but if you can’t figure it out, that’s why we’re here.
Another problem I often notice is that programmers try different things until they get it to work the way that they want. This is quite natural. But often they leave in unnecessary complexity that not only makes their code slower, but makes it bigger causing it to be less maintainable.
Originally the application I’m currently working on was created by @reinzor, he has some posts on the forum.
It’s a very complex application in the way it utilizes GOJS. That and other packages, think about Turf.JS for example.
In our Node Templates we use shapes with geometry strings or shapes that are loaded in with panel item templates, pictures with SVG’s. Data bindings that go two ways, data bindings on the (Graph)object.
Alas, we also wrap the GOJS diagram and do logic on that too, that and we use the GOJS overview as well.
So I feel like on our side there are tiny implementation mistakes that may cause the overall performance to degrade, hence I was also looking at what was exactly happening and why DoModelChanged was called before we committed our transaction (The original reason for this post).
But I’ll keep searching and if I figure it isn’t on our side, which I doubt… I’ll keep you posted, ha- Ha.