Using gojs, I am trying to make a table with the top two columns looking like a Gantt chart header. See example below - made from Excel to illustrate the intention.
I am struggling with assignment of itemarrays and itemTemplates, and colSpan. At this stage I do not think posting my code would be constructive and I am keen to see how it should be done.
Please could you direct me to examples or documentation that would assist me in understanding the approach ?
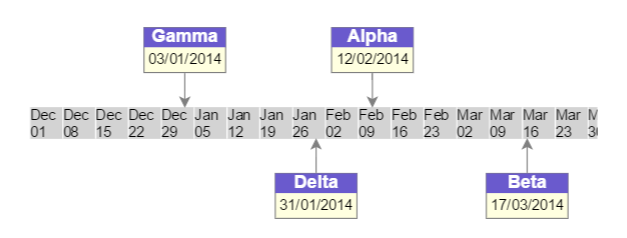
I looked at it but at first sight it did not seem to be the same case. For those following the case the image below is the timeline sample. I found it useful to review but I didn’t have a eureka moment. Any pointers about how it matches my needs ?
Well, first you can ignore the nodes and links from that sample.
But notice that there is a “Line” category node template. This contains a Grid Panel (named “BAR”) consisting of only white vertical lines on a lightgray background.
Furthermore there is a Table Panel (named “TABLE”) whose Panel.itemArray is set to an Array of Date objects. The itemTemplate is a TableColumn Panel containing only a TextBlock whose TextBlock.text property is data bound to the Date object.
The TimelineLayout’s execution is what creates the Array of Dates and sets the “BAR”-named Panel.gridCellSize and Panel.gridOrigin and sets the “TABLE”-named Panel.itemArray and RowColumnDefinition.widths.
If you are just getting started with GoJS, this may be a bit overwhelming. I highly recommend that you first read Get Started with GoJS and then GoJS Introduction -- Northwoods Software and all of the Introduction pages that seem relevant to your app.
We have considered creating a timeline component in GoJS, which might make it easier to understand what you can fiddle with and what is an internal implementation detail. This way you are seeing everything, which is way more complicated than you probably need to see it.
Thanks. I’ve gone back over my thinking and modified my approach. I am now generating an abstract data model of the chart as rows & columns, but I pre-process this in to cells to produce a gojs data model that can then provide row, column and columnSpan values for each cell. The cells are planel.Auto type rather than tableRow as I was using before.
In this way it appears that it is not necessary to have the cells in display order, which is a useful freedom.