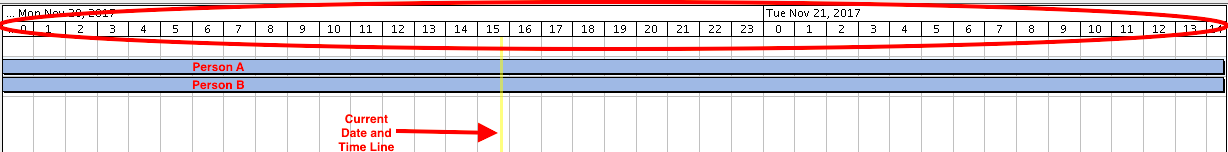
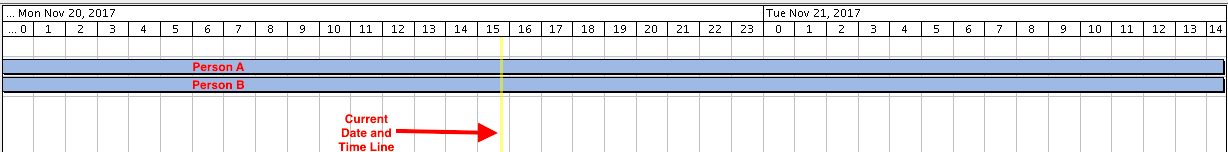
Is it possible to have a diagram which looks like this:
Thanks.
Certainly. What problems have you run into since adapting the above code?
Above mentioned code is correctly showing the timelines.
But using this code, i am not able to add the blue lines as shown in the previous diagram which denotes the data for 2 persons (A & B) across the timeline, along with the “Yellow” vertical line which represents the current time of the day.
Thanks.
OK, so you’re not actually asking about timelines, but about Gantt-like charts. Have you seen Gantt chart ?
The yellow vertical line you can implement as an un-modeled Part in the “Foreground” layer that you position programmatically. If you don’t want the user to interact with that line, set Part.pickable and Part.selectable to false.
@walter, Yes, i have checked the gantt.html link. There timeline is shown using hard coded values in node data.
But my requirement is to use a proper(dynamic) timeline which looks like this (In Red Oval):
Yes, it is a gantt chart diagram, but with a timeline.
How can i achieve this. Please help.
Thanks.
Apparently this topic is continued at: Background gridlines for timeline