Hi,
I am a newbie to GoJS and have a basic question regarding GoJS layout.
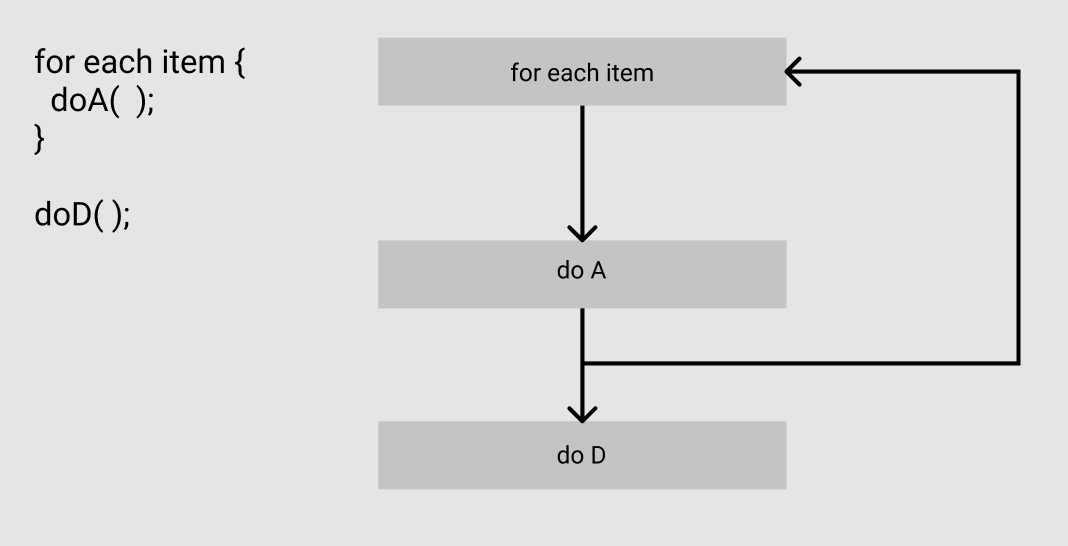
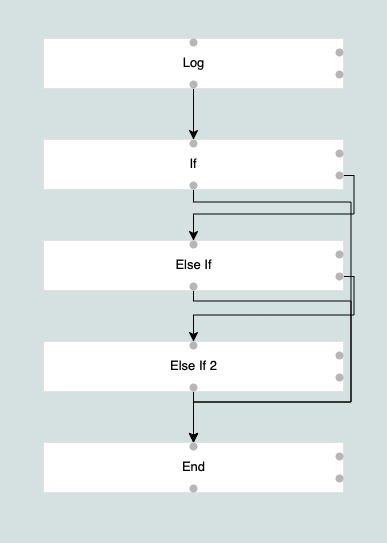
I have a simple graph. If I am using TreeLayout, the default display is as below
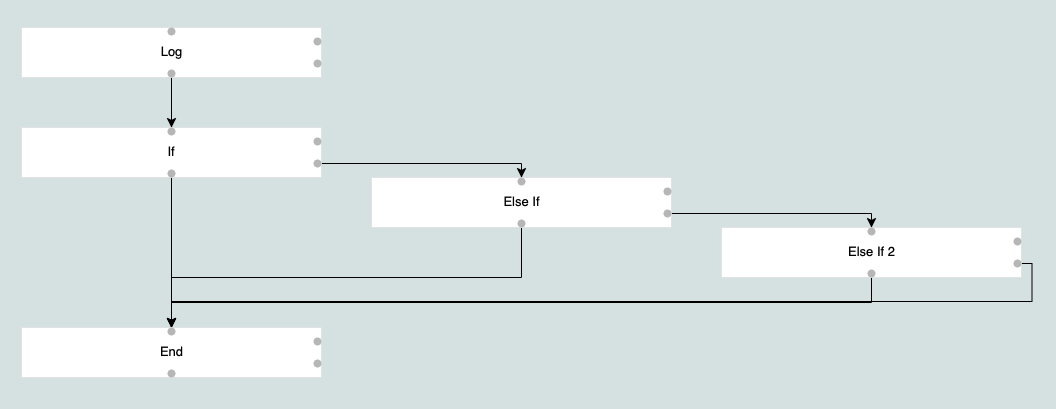
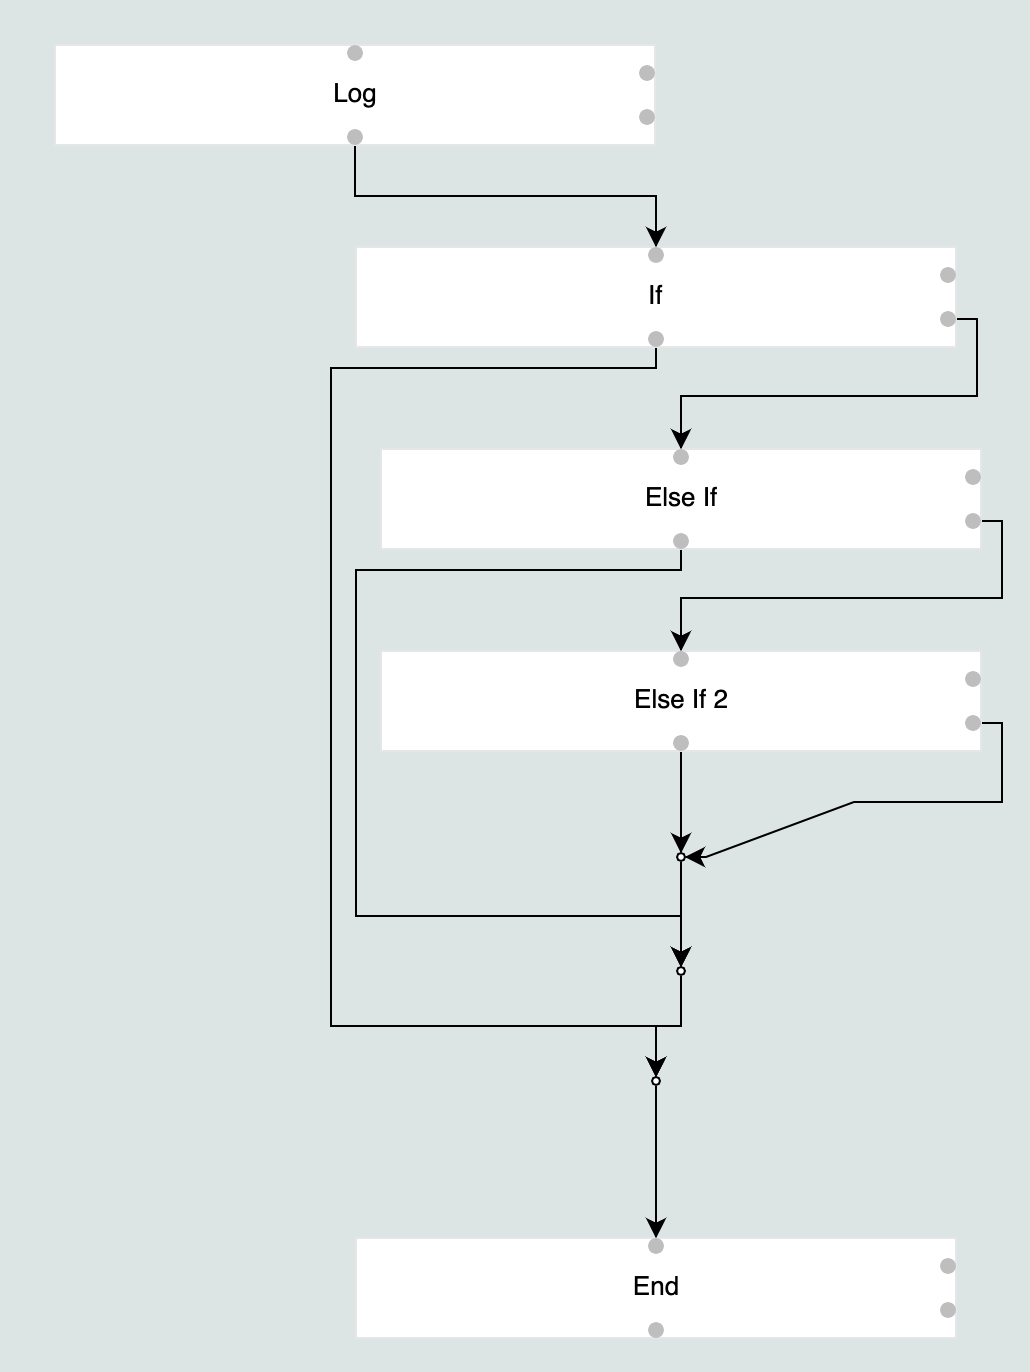
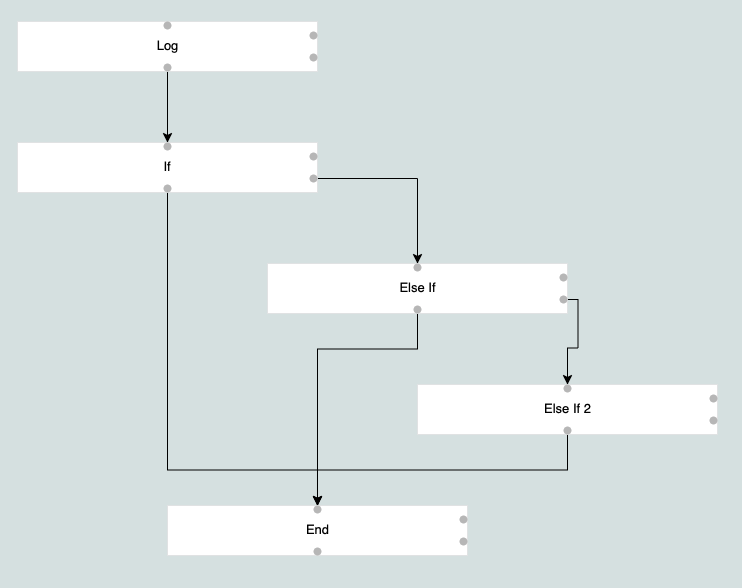
What I really want is the following: (by removing the layout option and specifying the locations of all the nodes)
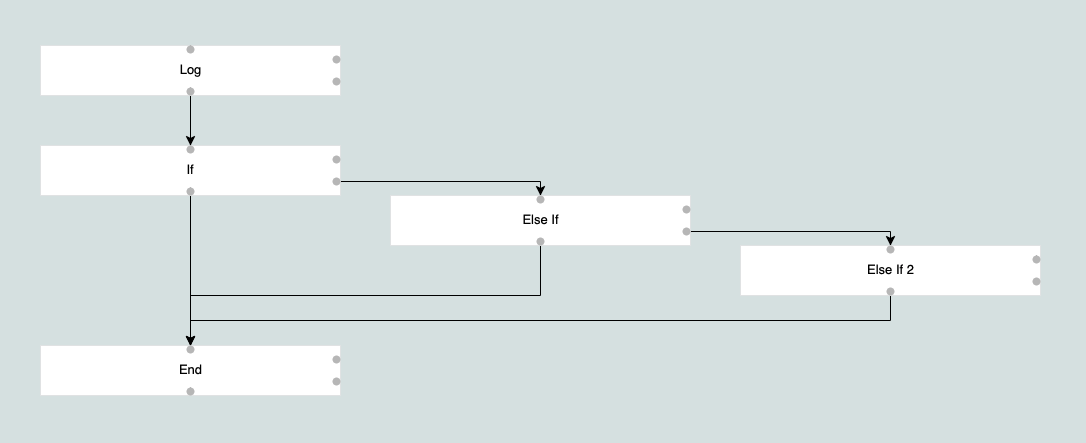
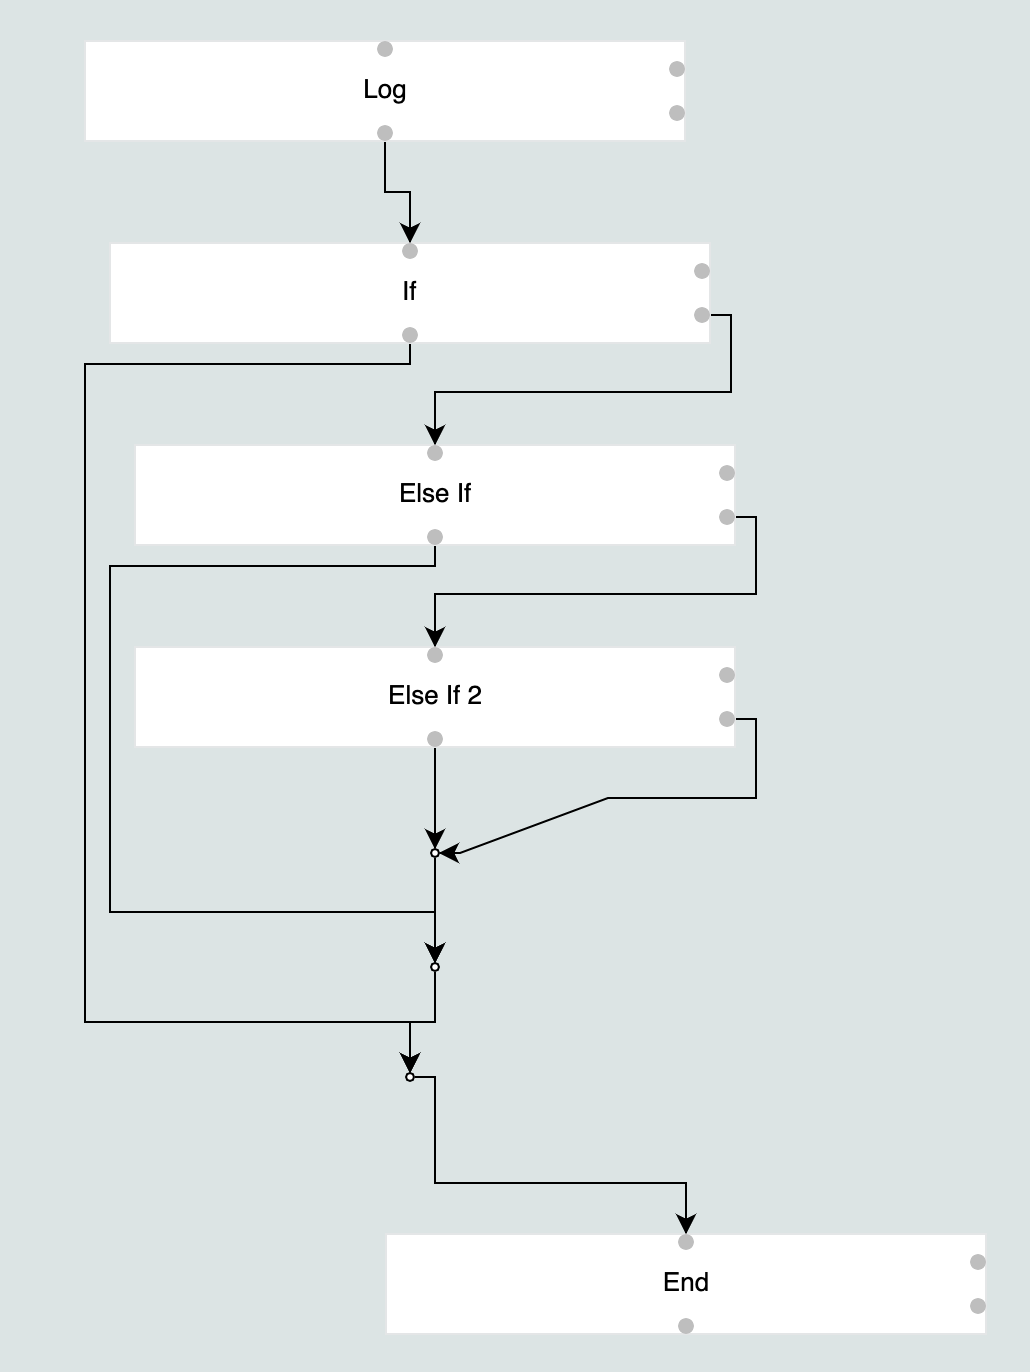
I also tried LayeredDigraphLayout, but the display is not quite similar to the second display either.
My question is: can I use the provided GoJS layouts and their configurations/customizations to mimic the second display without the location binding.
I am posting my index.html (including the JavaScript code) below. You can tweak the LOC_BINDING and LAYOUT values to reproduce the three displays above.
Any guidance would be really appreciated!
<!DOCTYPE html>
<html lang="en">
<head>
    <meta charset="UTF-8">
    <meta http-equiv="X-UA-Compatible" content="IE=edge">
    <meta name="viewport" content="width=device-width, initial-scale=1.0">
    <title>Document</title>
</head>
<body>
    <div id="myDiagramDiv" style="width:1500px; height:800px; background-color: #dae4e4;"></div>
    <script src="../../release/go-debug.js"></script>
    <script>
const $ = go.GraphObject.make;

const LAYOUT_TREE = "tree";
const LAYOUT_LAYERED = "layered";
const LAYOUT_NONE = "";

const LOC_BINDING = true;
const LAYOUT = LAYOUT_NONE;

let layout = {};
switch (LAYOUT) {
  case LAYOUT_TREE:
    layout = {
      layout: $(go.TreeLayout, {
        angle: 90,
        nodeSpacing: 50,
        layerSpacing: 50,
        setsChildPortSpot: false,
        setsPortSpot: false,
        alignment: go.TreeLayout.AlignmentStart,
      }),
    };
    break;
  case LAYOUT_LAYERED:
    layout = {
      layout: $(go.LayeredDigraphLayout, {
        direction: 90,
        layerSpacing: 50,
        columnSpacing: 50,
        setsPortSpots: false,
      }),
    };
    break;
}

const myDiagram = $(go.Diagram, "myDiagramDiv", layout);

const nodeTemplate = $(
  go.Node,
  "Position",
  $(
    go.Panel,
    "Auto",
    $(go.Shape, "Rectangle", {
      fill: "#ffffff",
      stroke: "#E4E6E7",
      width: 300,
      height: 50,
    }),
    $(go.TextBlock, new go.Binding("text", "text"))
  ),

  // ports
  $(go.Shape, "Circle", {
    width: 8,
    height: 8,
    fill: "#bebebe",
    stroke: null,
    position: new go.Point(146, 0),
    portId: "enter",
    toSpot: go.Spot.Top,
  }),
  $(go.Shape, "Circle", {
    width: 8,
    height: 8,
    fill: "#bebebe",
    stroke: null,
    position: new go.Point(146, 42),
    portId: "exit",
    fromSpot: go.Spot.Bottom,
  }),
  $(go.Shape, "Circle", {
    width: 8,
    height: 8,
    fill: "#bebebe",
    stroke: null,
    position: new go.Point(292, 10),
    portId: "second-enter",
    toSpot: go.Spot.Right,
  }),
  $(go.Shape, "Circle", {
    width: 8,
    height: 8,
    fill: "#bebebe",
    stroke: null,
    position: new go.Point(292, 32),
    portId: "second-exit",
    fromSpot: go.Spot.Right,
  })
);

if (LOC_BINDING) {
  nodeTemplate.bind(new go.Binding("location", "loc", go.Point.parse));
}

myDiagram.nodeTemplate = nodeTemplate;

myDiagram.linkTemplate = $(
  go.Link,
  { routing: go.Link.AvoidsNodes },
  $(go.Shape),
  $(go.Shape, { toArrow: "Standard" })
);

const nodeArray = [
  {
    key: "1",
    text: "Log",
    loc: "0 0",
  },
  {
    key: "2",
    text: "If",
    loc: "0 100",
  },
  {
    key: "3",
    text: "Else If",
    loc: "350 150",
  },
  {
    key: "4",
    text: "Else If 2",
    loc: "700 200",
  },
  {
    key: "5",
    text: "End",
    loc: "0 300",
  },
];

const linkArray = [
  {
    from: "1",
    to: "2",
    fromPort: "exit",
    toPort: "enter",
  },
  {
    from: "2",
    to: "5",
    fromPort: "exit",
    toPort: "enter",
  },
  {
    from: "2",
    to: "3",
    fromPort: "second-exit",
    toPort: "enter",
  },
  {
    from: "3",
    to: "4",
    fromPort: "second-exit",
    toPort: "enter",
  },
  {
    from: "3",
    to: "5",
    fromPort: "exit",
    toPort: "enter",
  },
  {
    from: "4",
    to: "5",
    fromPort: "exit",
    toPort: "enter",
  },
];

myDiagram.model = $(go.GraphLinksModel, {
  linkFromPortIdProperty: "fromPort",
  linkToPortIdProperty: "toPort",
  nodeDataArray: nodeArray,
  linkDataArray: linkArray,
});
    </script>
</body>
</html>