GoJS table layout clarifications

Hi team,

I have seen your sample of Table layout as shown below:

scenarios:

  1. I can increase the column width easily as shown below.

  1. I can move nodes within cells as shown below. The cell size will not be modified in this case.

  2. When I tried to move a node from cell 2 to cell 3 whole matrix got resized. As shown below:

My concern is need the same behavior as we do in step 2. I don’t want to rearrange my matrix when moving node from one cell to another. The user preference need not to be changed. Please help me with your suggestions.

That policy is implemented by the Group’s GraphObject.mouseDrop event handler. If you comment out these lines that set the RowColumnDefinition.height and .width to NaN, I think you will see the behavior that you want:

            if (!anyHeadersSiders && group.addMembers(e.diagram.selection, true)) {
              //if (anynew) {
              //  e.diagram.layout.getRowDefinition(group.row).height = NaN;
              //  e.diagram.layout.getColumnDefinition(group.column).width = NaN;
              //}
            } else {  // failure upon trying to add parts to this group
              e.diagram.currentTool.doCancel();
            }

Thanks for the reply. I did what you said. Got following issues.

  1. Nodes can be placed on the left side of cell
  2. Nodes can be placed in the bottom of cell

Shown below

Please suggest some solutions for same.

You didn’t specify, so I thought you wanted whatever size the user specified by resizing a row or a column to be kept.

But I just tried it again, modifying a copy of the Table Layout page, and I did not get the behavior that you describe.

I will detail you our requirement and issue we are facing

Requirement:

As you mentioned, When user increase the size of row or column, then never automatically let it reduce when we remove a node from a specific row or column.
At the same time user tries to add a node on the border, this time it should automatically increase the row or column size in such a way to keep the node inside the cell.
We never expect the node to be placed in the Border.

In short, never let automatically reduce the row or column size. Mean time it should allow to increase the row/column size automatically.

Issue:
We tried the code snippet you have mentioned - “Comment out these lines that set the RowColumnDefinition.height and .width to NaN”.
This addressed the auto resize issue. But when we add new node in the border, that point we are expecting cell to be adjusted in such a way to place the node inside cell itself.

Could you please share a solution which address both requirements.

I have tried the code sample only :

.....................
.......................
    myDiagram.groupTemplate =  // for cells
      $(go.Group, "Auto",
        {
          layerName: "Background",
          stretch: go.GraphObject.Fill,
          selectable: false,
          computesBoundsAfterDrag: true,
          computesBoundsIncludingLocation: true,
          handlesDragDropForMembers: true,  // don't need to define handlers on member Nodes and Links
          mouseDragEnter: function(e, group, prev) { group.isHighlighted = true; },
          mouseDragLeave: function(e, group, next) { group.isHighlighted = false; },
          mouseDrop: function(e, group) {
            // if any dropped part wasn't already a member of this group, we'll want to let the group's row
            // column allow themselves to be resized automatically, in case the row height or column width
            // had been set manually by the LaneResizingTool
            var anynew = e.diagram.selection.any(function(p) { return p.containingGroup !== group; });
            // Don't allow headers/siders to be dropped
            var anyHeadersSiders = e.diagram.selection.any(function(p) {
              return p.category === "Column Header" || p.category === "Row Sider";
            });
            if (!anyHeadersSiders && group.addMembers(e.diagram.selection, true)) {
              if (anynew) {
                //e.diagram.layout.getRowDefinition(group.row).height = NaN;
                //e.diagram.layout.getColumnDefinition(group.column).width = NaN;
              }
            } else {  // failure upon trying to add parts to this group
              e.diagram.currentTool.doCancel();
            }
          }
        },
.....................
.....................

As I mentioned I am getting the following output.

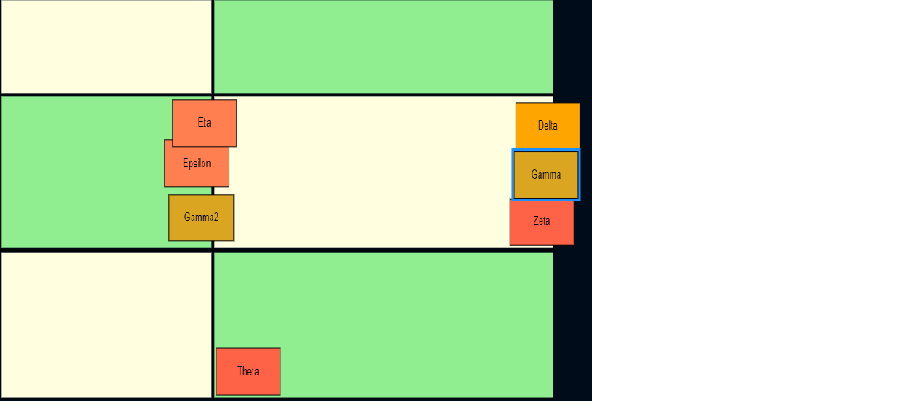
To be clear my requirements are as follows:

  1. Nodes must be kept inside the cell, not on the border of the cell.
  2. It must keep the user preference provided like The cell size increased should not be decreased/resized

Note:

  1. with the fix you provided I have commented the two lines.Resize issue solved,but I faced the issue of putting nodes on border.
  2. I feel the issue is coming on the right border of cell, rest all is working fine

There must be something in your app that is causing that behavior.

When I modify a copy of the Table Layout page, all I do is comment out that code to reset RowColumnDefinition properties:

            if (!anyHeadersSiders && group.addMembers(e.diagram.selection, true)) {
              //if (anynew) {
              //  e.diagram.layout.getRowDefinition(group.row).height = NaN;
              //  e.diagram.layout.getColumnDefinition(group.column).width = NaN;
              //}
            } else {  // failure upon trying to add parts to this group

Then when I drag-and-drop a node from the Palette, I find that when I drop a node so that it overlaps a border, the Group into which the Node was dropped will automatically increase in width and/or height so that it surrounds the whole Node.

Here all I have done is drop a “Gamma” node and a “Beta” node:

Which as you can see is causes both the “Request” and the “Approval” columns to be wider than they were originally.

Thanks for the Reply Walter.

Issue:

I can drag the node and can put on the right side borders.

I am using the sample code from GOJS only (it is not my application). Pasting my whole code for your reference.

Sample code from GOJS:

  // define a custom ResizingTool to limit how far one can shrink a row or column
  function LaneResizingTool() {
    go.ResizingTool.call(this);
  }
  go.Diagram.inherit(LaneResizingTool, go.ResizingTool);
  /** @override */
  LaneResizingTool.prototype.computeMinSize = function() {
    var diagram = this.diagram;
    var lane = this.adornedObject.part;  // might be row or column
    var horiz = (lane.category === "Column Header");  // or "Row Header"
    var margin = diagram.nodeTemplate.margin;
    var bounds = new go.Rect();
    diagram.findTopLevelGroups().each(function(g) {
      if (horiz ? (g.column === lane.column) : (g.row === lane.row)) {
        var b = diagram.computePartsBounds(g.memberParts);
        if (b.isEmpty()) return;  // nothing in there?  ignore it
        b.unionPoint(g.location);  // keep any empty space on the left and top
        b.addMargin(margin);  // assume the same node margin applies to all nodes
        if (bounds.isEmpty()) {
          bounds = b;
        } else {
          bounds.unionRect(b);
        }
      }
    });
    // limit the result by the standard value of computeMinSize
    var msz = go.ResizingTool.prototype.computeMinSize.call(this);
    if (bounds.isEmpty()) return msz;
    return new go.Size(Math.max(msz.width, bounds.width), Math.max(msz.height, bounds.height));
  };
  /** @override */
  LaneResizingTool.prototype.resize = function(newr) {
    var lane = this.adornedObject.part;
    var horiz = (lane.category === "Column Header");
    var lay = this.diagram.layout;  // the TableLayout
    if (horiz) {
      var col = lane.column;
      var coldef = lay.getColumnDefinition(col);
      coldef.width = newr.width;
    } else {
      var row = lane.row;
      var rowdef = lay.getRowDefinition(row);
      rowdef.height = newr.height;
    }
    lay.invalidateLayout();
  };
  // end LaneResizingTool class
  function init() {
    if (window.goSamples) goSamples();  // init for these samples -- you don't need to call this
    var $ = go.GraphObject.make;
    myDiagram =
      $(go.Diagram, "myDiagramDiv",
        {
          initialContentAlignment: go.Spot.Center,
          layout: $(TableLayout,
                    $(go.RowColumnDefinition, { row: 1, height: 22 }),  // fixed size column headers
                    $(go.RowColumnDefinition, { column: 1, width: 22 }) // fixed size row headers
                  ),
          "SelectionMoved": function(e) { e.diagram.layoutDiagram(true); },
          "resizingTool": new LaneResizingTool(),
          allowDrop: true,
          // feedback that dropping in the background is not allowed
          mouseDragOver: function(e) { e.diagram.currentCursor = "not-allowed"; },
          // when dropped in the background, not on a Node or a Group, cancel the drop
          mouseDrop: function(e) { e.diagram.currentTool.doCancel(); },
          "animationManager.isInitial": false,
          "undoManager.isEnabled": true
        });
    myDiagram.nodeTemplateMap.add("Header",  // an overall table header, at the top
      $(go.Part, "Auto",
        {
          row: 0, column: 1, columnSpan: 9999,
          stretch: go.GraphObject.Horizontal,
          selectable: false, pickable: false
        },
        $(go.Shape, { fill: "transparent", strokeWidth: 0 }),
        $(go.TextBlock, { alignment: go.Spot.Center, font: "bold 12pt sans-serif" },
          new go.Binding("text"))
      ));
    myDiagram.nodeTemplateMap.add("Sider",  // an overall table header, on the left side
      $(go.Part, "Auto",
        {
          row: 1, rowSpan: 9999, column: 0,
          stretch: go.GraphObject.Vertical,
          selectable: false, pickable: false
        },
        $(go.Shape, { fill: "transparent", strokeWidth: 0 }),
        $(go.TextBlock, { alignment: go.Spot.Center, font: "bold 12pt sans-serif", angle: 270 },
          new go.Binding("text"))
      ));
    myDiagram.nodeTemplateMap.add("Column Header",  // for each column header
      $(go.Part, "Spot",
        {
          row: 1, rowSpan: 9999, column: 2,
          minSize: new go.Size(100, NaN),
          stretch: go.GraphObject.Fill,
          movable: false,
          resizable: true,
          resizeAdornmentTemplate:
            $(go.Adornment, "Spot",
              $(go.Placeholder),
              $(go.Shape,  // for changing the length of a lane
                {
                  alignment: go.Spot.Right,
                  desiredSize: new go.Size(7, 50),
                  fill: "lightblue", stroke: "dodgerblue",
                  cursor: "col-resize"
                })
            )
        },
        new go.Binding("column", "col"),
        $(go.Shape, { fill: null },
          new go.Binding("fill", "color")),
        $(go.Panel, "Auto",
          { // this is positioned above the Shape, in row 1
            alignment: go.Spot.Top, alignmentFocus: go.Spot.Bottom,
            stretch: go.GraphObject.Horizontal,
            height: myDiagram.layout.getRowDefinition(1).height
          },
          $(go.Shape, { fill: "transparent", strokeWidth: 0 }),
          $(go.TextBlock,
            {
              font: "bold 10pt sans-serif", isMultiline: false,
              wrap: go.TextBlock.None, overflow: go.TextBlock.OverflowEllipsis
            },
            new go.Binding("text"))
        )
      ));
    myDiagram.nodeTemplateMap.add("Row Sider",  // for each row header
      $(go.Part, "Spot",
        {
          row: 2, column: 1, columnSpan: 9999,
          minSize: new go.Size(NaN, 100),
          stretch: go.GraphObject.Fill,
          movable: false,
          resizable: true,
          resizeAdornmentTemplate:
            $(go.Adornment, "Spot",
              $(go.Placeholder),
              $(go.Shape,  // for changing the breadth of a lane
                {
                  alignment: go.Spot.Bottom,
                  desiredSize: new go.Size(50, 7),
                  fill: "lightblue", stroke: "dodgerblue",
                  cursor: "row-resize"
                })
            )
        },
        new go.Binding("row"),
        $(go.Shape, { fill: null },
          new go.Binding("fill", "color")),
        $(go.Panel, "Auto",
          { // this is positioned to the left of the Shape, in column 1
            alignment: go.Spot.Left, alignmentFocus: go.Spot.Right,
            stretch: go.GraphObject.Vertical, angle: 270,
            height: myDiagram.layout.getColumnDefinition(1).width
          },
          $(go.Shape, { fill: "transparent", strokeWidth: 0 }),
          $(go.TextBlock,
            {
              font: "bold 10pt sans-serif", isMultiline: false,
              wrap: go.TextBlock.None, overflow: go.TextBlock.OverflowEllipsis
            },
            new go.Binding("text"))
        )
      ));
    myDiagram.nodeTemplate =  // for regular nodes within cells (groups); you'll want to extend this
      $(go.Node, "Auto",
        { width: 100, height: 50, margin: 4 },  // assume uniform Margin, all around
        new go.Binding("row"),
        new go.Binding("column", "col"),
        $(go.Shape, { fill: "white" },
          new go.Binding("fill", "color")),
        $(go.TextBlock,
          new go.Binding("text", "key"))
      );
    myDiagram.groupTemplate =  // for cells
      $(go.Group, "Auto",
        {
          layerName: "Background",
          stretch: go.GraphObject.Fill,
          selectable: false,
          computesBoundsAfterDrag: true,
          computesBoundsIncludingLocation: true,
          handlesDragDropForMembers: true,  // don't need to define handlers on member Nodes and Links
          mouseDragEnter: function(e, group, prev) { group.isHighlighted = true; },
          mouseDragLeave: function(e, group, next) { group.isHighlighted = false; },
          mouseDrop: function(e, group) {
            // if any dropped part wasn't already a member of this group, we'll want to let the group's row
            // column allow themselves to be resized automatically, in case the row height or column width
            // had been set manually by the LaneResizingTool
            var anynew = e.diagram.selection.any(function(p) { return p.containingGroup !== group; });
            // Don't allow headers/siders to be dropped
            var anyHeadersSiders = e.diagram.selection.any(function(p) {
              return p.category === "Column Header" || p.category === "Row Sider";
            });
            if (!anyHeadersSiders && group.addMembers(e.diagram.selection, true)) {
              if (anynew) {
               // e.diagram.layout.getRowDefinition(group.row).height = NaN;
              //  e.diagram.layout.getColumnDefinition(group.column).width = NaN;
              }
            } else {  // failure upon trying to add parts to this group
              e.diagram.currentTool.doCancel();
            }
          }
        },
        new go.Binding("row"),
        new go.Binding("column", "col"),
        // the group is normally unseen -- it is completely transparent except when given a color or when highlighted
        $(go.Shape,
          {
            fill: "transparent", stroke: "transparent",
            strokeWidth: myDiagram.nodeTemplate.margin.left,
            stretch: go.GraphObject.Fill
          },
          new go.Binding("fill", "color"),
          new go.Binding("stroke", "isHighlighted", function(h) { return h ? "red" : "transparent"; }).ofObject()),
        $(go.Placeholder,
          { // leave a margin around the member nodes of the group which is the same as the member node margin
            alignment: (function(m) { return new go.Spot(0, 0, m.top, m.left); })(myDiagram.nodeTemplate.margin),
            padding: (function(m) { return new go.Margin(0, m.right, m.bottom, 0); })(myDiagram.nodeTemplate.margin)
          })
      );
    myDiagram.model = new go.GraphLinksModel([
      // headers
      { key: "Header", text: "Vacation Procedures", category: "Header" },
      { key: "Sider", text: "Personnel", category: "Sider" },
      // column and row headers
      { key: "Request", text: "Request", col: 2, category: "Column Header" },
      { key: "Approval", text: "Approval", col: 3, category: "Column Header" },
      { key: "Employee", text: "Employee", row: 2, category: "Row Sider" },
      { key: "Manager", text: "Manager", row: 3, category: "Row Sider" },
      { key: "Administrator", text: "Administrator", row: 4, category: "Row Sider" },
      // cells, each a group assigned to a row and column
      { key: "EmpReq", row: 2, col: 2, isGroup: true, color: "lightyellow" },
      { key: "EmpApp", row: 2, col: 3, isGroup: true, color: "lightgreen" },
      { key: "ManReq", row: 3, col: 2, isGroup: true, color: "lightgreen" },
      { key: "ManApp", row: 3, col: 3, isGroup: true, color: "lightyellow" },
      { key: "AdmReq", row: 4, col: 2, isGroup: true, color: "lightyellow" },
      { key: "AdmApp", row: 4, col: 3, isGroup: true, color: "lightgreen" },
      // nodes, each assigned to a group/cell
      { key: "Delta", color: "orange", size: "100 100", group: "EmpReq" },
      { key: "Epsilon", color: "coral", size: "100 50", group: "EmpReq" },
      { key: "Zeta", color: "tomato", size: "50 70", group: "ManReq" },
      { key: "Eta", color: "coral", size: "50 50", group: "ManApp" },
      { key: "Theta", color: "tomato", size: "100 50", group: "AdmApp" }
    ]);
    myPalette =
      $(go.Palette, "myPaletteDiv",
        {
          nodeTemplateMap: myDiagram.nodeTemplateMap,
          "model.nodeDataArray": [
            { key: "Alpha", color: "orange" },
            { key: "Beta", color: "tomato" },
            { key: "Gamma", color: "goldenrod" }
          ]
        });
  }
</script>

Can you reproduce that behavior in Table Layout ?

If not, what is different about your code?

Yes I have reproduced it. The image is attached in my reply. It is showing the nodes placed in the border. I have used the sample code only.

Steps to reproduce the behavior.

  1. Comment the two lines in the code
if (anynew) {
               // e.diagram.layout.getRowDefinition(group.row).height = NaN;
              //  e.diagram.layout.getColumnDefinition(group.column).width = NaN;
              }
  1. Increase the width of a cell
  2. Take a node and drag it to the right border of the cell
  3. It will be placed the in the cell border

If you want the row and column to increase after the user has set their height and width, you need to set the RowColumnDefinition.height and width to NaN.

Apparently you want rows and columns to always increase in side but never decrease unless the user resizes them that way. Is that correct?

I haven’t tried this, but I wonder if maybe the cell/group’s minSize needs to be set to its latest size, and resizing would explicitly remove that minSize constraint.

What u said is correct. I dont want to decrease cell size. Could you please help me with a sample what you suggested.

OK, I’ve added a custom TableLayout, named IncreasingSizeTableLayout, that you can find at Page Not Found -- Northwoods Software

That also requires modifying the LaneResizingTool as shown in that file, as well as removing those two lines in the Group.mouseDrop event handler that you have already removed.

Thank you very much. Will try and let you know

Thanks for the sample Walter.

In your sample you have a TableLayout.js file link but the link has no file in it. Could you please send me a valid link to that file.

In the sample Table Layout there is a link to http://gojs.net/latest/extensions/TableLayout.js

Hi walter,

Your sample works great in the predefined cell width height. Nodes placing work perfectly. But the issue of placing nodes in border still reproduce once u change the cell size manually. Steps to reproduce in your current sample.

  1. increase cell width a little bit on right side
  2. Drag the node and place in the right border. It will be placed there.

The issue comes only after manually increase the cell width.

I have updated the Page Not Found -- Northwoods Software sample, and it now uses a slightly modified Page Not Found -- Northwoods Software class, for cleaner code.