The following code produces:
<!DOCTYPE html>
<html><body>
<script src="go.js"></script>
<script id="code">
function init() {
// Since 2.2 you can also author concise templates with method chaining instead of GraphObject.make
// For details, see https://gojs.net/latest/intro/buildingObjects.html
const $ = go.GraphObject.make; // for conciseness in defining templates
myDiagram = new go.Diagram("myDiagramDiv", // create a Diagram for the DIV HTML element
{
"animationManager.isEnabled": false,
"commandHandler.decreaseZoom": function() { changeScale(1/1.05) }, // method override must be function, not =>
"commandHandler.increaseZoom": function() { changeScale(1.05) }, // method override must be function, not =>
"commandHandler.resetZoom": function() { setScale(1.0) }, // method override must be function, not =>
layout: $(TimelineLayout),
isTreePathToChildren: false // arrows from children (events) to the parent (timeline bar)
});
function changeScale(factor) {
const oldscale = myDiagram.model.modelData.scale || 1.0;
const newscale = factor ? (oldscale * factor) : 1.0;
setScale(newscale);
}
function setScale(scale) {
const docpt = myDiagram.lastInput.documentPoint.copy();
let line = null;
myDiagram.commit(diag => {
diag.model.set(diag.model.modelData, "scale", scale);
diag.nodes.each(n => {
if (n.category === "Line") {
line = n;
n.updateTargetBindings();
return;
}
});
}, null); // no UndoManager
if (line !== null && docpt.x > line.position.x) {
myDiagram.position = new go.Point(docpt.x - (docpt.x-line.position.x)/scale, myDiagram.position.y);
}
}
myDiagram.nodeTemplate =
$(go.Node, "Table",
{ locationSpot: go.Spot.Center, movable: false },
$(go.Panel, "Auto",
$(go.Shape, "RoundedRectangle",
{ fill: "#252526", stroke: "#519ABA", strokeWidth: 3 }
),
$(go.Panel, "Table",
$(go.TextBlock,
{
row: 0,
stroke: "#CCCCCC",
wrap: go.Wrap.Fit,
font: "bold 12pt sans-serif",
textAlign: "center", margin: 4
},
new go.Binding("text", "event")
),
$(go.TextBlock,
{
row: 1,
stroke: "#A074C4",
textAlign: "center", margin: 4
},
new go.Binding("text", "date", d => d.toLocaleDateString())
)
)
)
);
myDiagram.nodeTemplateMap.add("Line",
$(go.Node, "Spot",
{
movable: false, copyable: false,
resizable: true, resizeObjectName: "MAIN",
resizeAdornmentTemplate: // only resizing at right end
$(go.Adornment, "Spot",
$(go.Placeholder),
$(go.Shape, { alignment: go.Spot.Right, cursor: "e-resize", desiredSize: new go.Size(4, 16), fill: "lightblue", stroke: "deepskyblue" })
)
},
$(go.Panel, "Graduated",
{
name: "GRADUATED",
background: "transparent",
graduatedMin: 0,
graduatedMax: 365,
graduatedTickUnit: 1
},
new go.Binding("graduatedMax", "", timelineDays),
$(go.Shape, "LineH",
{ name: "MAIN", stroke: "#519ABA", height: 1, strokeWidth: 3 },
new go.Binding("width", "length", (l, shape) => l * (shape.diagram.model.modelData.scale || 1.0))
.makeTwoWay((w, data, model) => w/(model.modelData.scale || 1.0))
),
// hide all tick marks
//$(go.Shape, { geometryString: "M0 0 V10", interval: 7, stroke: "#519ABA", strokeWidth: 2 }),
// hide all tick labels
// $(go.TextBlock,
// {
// font: "10pt sans-serif",
// stroke: "#CCCCCC",
// interval: 14,
// alignmentFocus: go.Spot.Right,
// segmentOrientation: go.Orientation.Minus90,
// segmentOffset: new go.Point(0, 12),
// graduatedFunction: valueToDate
// },
// new go.Binding("interval", "length", calculateLabelInterval)
// )
),
$(go.Shape,
{
alignment: new go.Spot(1, 0, 0, 3/2), alignmentFocus: go.Spot.Right,
geometryString: "M0 0 L20 10 0 20",
stroke: "#519ABA", strokeWidth: 3
}
),
$(go.TextBlock,
{ alignment: new go.Spot(0, 0, 0, 5), alignmentFocus: go.Spot.TopLeft, stroke: "#CCCCCC" },
new go.Binding("text", "start", d => d.toLocaleDateString())),
$(go.TextBlock,
{ alignment: new go.Spot(1, 0, 0, 5), alignmentFocus: go.Spot.TopRight, stroke: "#CCCCCC" },
new go.Binding("text", "end", d => d.toLocaleDateString())),
)
);
function calculateLabelInterval(len) {
if (len >= 800) return 7;
else if (400 <= len && len < 800) return 14;
else if (200 <= len && len < 400) return 21;
else if (140 <= len && len < 200) return 28;
else if (110 <= len && len < 140) return 35;
else return 365;
}
// The template for the link connecting the event node with the timeline bar node:
myDiagram.linkTemplate =
$(BarLink, // defined below
{ toShortLength: 2, layerName: "Background" },
$(go.Shape, { stroke: "#E37933", strokeWidth: 2 })
);
// Setup the model data -- an object describing the timeline bar node
// and an object for each event node:
const data = [
{ // this defines the actual time "Line" bar
key: "timeline", category: "Line",
lineSpacing: 30, // distance between timeline and event nodes
length: 700, // the width of the timeline
start: new Date("1 Jan 2016"),
end: new Date("31 Dec 2016")
},
// the rest are just "events" --
// you can add as much information as you want on each and extend the
// default nodeTemplate to show as much information as you want
{ event: "New Year's Day", date: new Date("1 Jan 2016") },
{ event: "MLK Jr. Day", date: new Date("18 Jan 2016") },
{ event: "Presidents Day", date: new Date("15 Feb 2016") },
{ event: "Memorial Day", date: new Date("30 May 2016") },
{ event: "Independence Day", date: new Date("4 Jul 2016") },
{ event: "Labor Day", date: new Date("5 Sep 2016") },
{ event: "Columbus Day", date: new Date("10 Oct 2016") },
{ event: "Veterans Day", date: new Date("11 Nov 2016") },
{ event: "Thanksgiving", date: new Date("24 Nov 2016") },
{ event: "Christmas", date: new Date("25 Dec 2016") }
];
// prepare the model by adding links to the Line
for (let i = 0; i < data.length; i++) {
const d = data[i];
if (d.key !== "timeline") d.parent = "timeline";
}
myDiagram.model = new go.TreeModel( { nodeDataArray: data });
}
function timelineDays() {
const timeline = myDiagram.model.findNodeDataForKey("timeline");
const startDate = timeline.start;
const endDate = timeline.end;
function treatAsUTC(date) {
const result = new Date(date);
result.setMinutes(result.getMinutes() - result.getTimezoneOffset());
return result;
}
const millisecondsPerDay = 24 * 60 * 60 * 1000;
return (treatAsUTC(endDate) - treatAsUTC(startDate)) / millisecondsPerDay;
}
// This custom Layout locates the timeline bar at (0,0)
// and alternates the event Nodes above and below the bar at
// the X-coordinate locations determined by their data.date values.
class TimelineLayout extends go.Layout {
doLayout(coll) {
const diagram = this.diagram;
if (diagram === null) return;
coll = this.collectParts(coll);
diagram.startTransaction("TimelineLayout");
let line = null;
const parts = [];
const it = coll.iterator;
while (it.next()) {
const part = it.value;
if (part instanceof go.Link) continue;
if (part.category === "Line") { line = part; continue; }
parts.push(part);
let d = part.data.date;
if (d === undefined) { d = new Date(); part.data.date = d; }
}
if (!line) throw Error("No node of category 'Line' for TimelineLayout");
line.location = new go.Point(0, 0);
// lay out the events above the timeline
if (parts.length > 0) {
// determine the offset from the main shape to the timeline's boundaries
const main = line.findMainElement();
const sw = main.strokeWidth;
const mainOffX = main.actualBounds.x;
const mainOffY = main.actualBounds.y;
// spacing is between the Line and the closest Nodes, defaults to 30
let spacing = line.data.lineSpacing;
if (!spacing) spacing = 30;
for (let i = 0; i < parts.length; i++) {
const part = parts[i];
const bnds = part.actualBounds;
const dt = part.data.date;
const val = dateToValue(dt);
const pt = line.findObject("GRADUATED").graduatedPointForValue(val);
const tempLoc = new go.Point(pt.x, pt.y - bnds.height / 2 - spacing);
// check if this node will overlap with previously placed events, and offset if needed
for (let j = 0; j < i; j++) {
const partRect = new go.Rect(tempLoc.x, tempLoc.y, bnds.width, bnds.height);
const otherLoc = parts[j].location;
const otherBnds = parts[j].actualBounds;
const otherRect = new go.Rect(otherLoc.x, otherLoc.y, otherBnds.width, otherBnds.height);
if (partRect.intersectsRect(otherRect)) {
tempLoc.offset(0, -otherBnds.height - 10);
j = 0; // now that we have a new location, we need to recheck in case we overlap with an event we didn't overlap before
}
}
part.location = tempLoc;
}
}
diagram.commitTransaction("TimelineLayout");
}
}
// end TimelineLayout class
// This custom Link class was adapted from several of the samples
class BarLink extends go.Link {
getLinkPoint(node, port, spot, from, ortho, othernode, otherport) {
const r = port.getDocumentBounds();
const op = otherport.getDocumentPoint(go.Spot.Center);
const main = node.category === "Line" ? node.findMainElement() : othernode.findMainElement();
const mainOffY = main.actualBounds.y;
let y = r.top;
if (node.category === "Line") {
y += mainOffY;
if (op.x < r.left) return new go.Point(r.left, y);
if (op.x > r.right) return new go.Point(r.right, y);
return new go.Point(op.x, y);
} else {
return new go.Point(r.centerX, r.bottom);
}
}
}
// end BarLink class
function valueToDate(n) {
const timeline = myDiagram.model.findNodeDataForKey("timeline");
const startDate = timeline.start;
const startDateMs = startDate.getTime() + startDate.getTimezoneOffset() * 60000;
const msPerDay = 24 * 60 * 60 * 1000;
const date = new Date(startDateMs + n * msPerDay);
return date.toLocaleDateString();
}
function dateToValue(d) {
const timeline = myDiagram.model.findNodeDataForKey("timeline");
const startDate = timeline.start;
const startDateMs = startDate.getTime() + startDate.getTimezoneOffset() * 60000;
const dateInMs = d.getTime() + d.getTimezoneOffset() * 60000;
const msSinceStart = dateInMs - startDateMs;
const msPerDay = 24 * 60 * 60 * 1000;
return msSinceStart / msPerDay;
}
window.addEventListener('DOMContentLoaded', init);
</script>
<div id="sample">
<div id="myDiagramDiv" style="border: solid 1px black; background: #252526; width:100%; height:400px"></div>
<p>
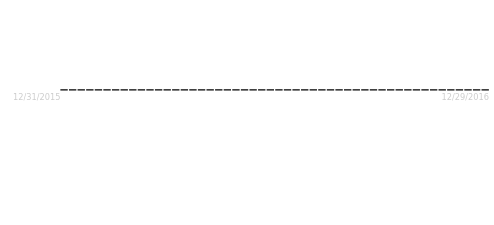
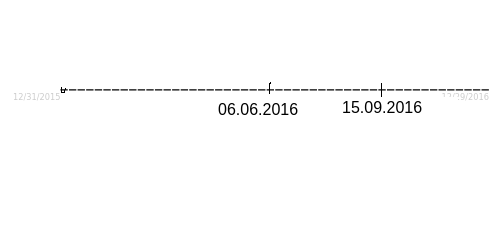
This sample demonstrates an example usage of a <a href="../intro/graduatedPanels.html">Graduated Panel</a> to draw ticks and text labels along a timeline.
</p>
<p>
The Panel uses a <a>Panel.graduatedTickUnit</a> of 1 to represent one day, and ticks are drawn at <a>Shape.interval</a>s of 7 to represent weeks.
</p>
<p>
Labels are drawn at <a>TextBlock.interval</a>s of 14, or every two weeks. As the timeline is resized, the interval is updated to prevent overlaps.
Text strings are generated by setting the <a>TextBlock.graduatedFunction</a>to convert from values in the graduated range to date strings.
Also notice that labels use the <a>GraphObject.alignmentFocus</a>, <a>GraphObject.segmentOrientation</a>,
and <a>GraphObject.segmentOffset</a> properties to place text below the timeline bar.
</p>
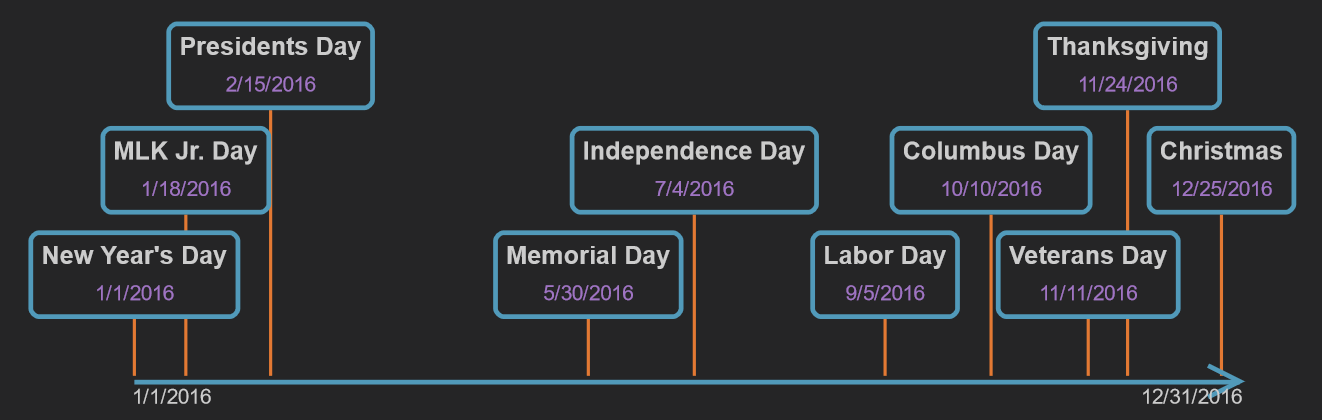
<p>
Try resizing the timeline: select the timeline and drag the resize handle that is on the right side. Event nodes
will automatically be laid out relative to the timeline using the <code>TimelineLayout</code>. TimelineLayout converts
a date to a value, then uses <a>Panel.graduatedPointForValue</a> to help determine where event nodes will be placed.
</p>
</div>
</body></html>