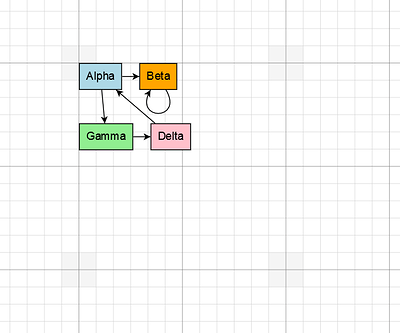
Grid with main intersection highlighted

I would like to create a background grid for the diagram with the main intersection coordinates highlighted. (Something similar to the image below.)

I am able to create the highlighting without the grid lines or the grid lines without the highlight, but I can’t find a way of combining the bars and lines to get the desired result.

I can see several potential new features that would help me, but nothing in the current version.

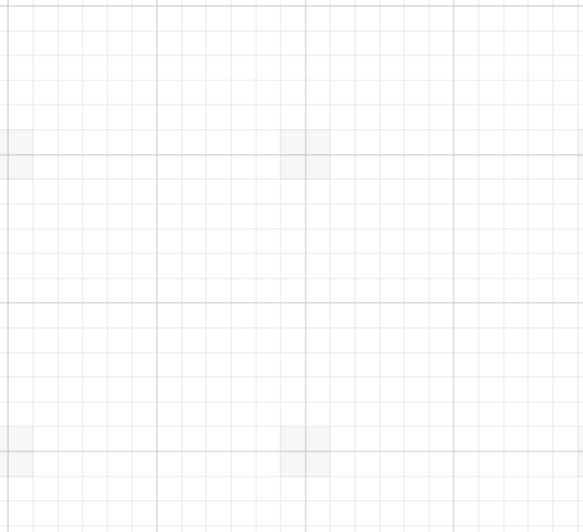
My goal:
I haven’t thought of a solution using the infinite Diagram.grid either. We’ll investigate it. What new features were you thinking of?

In the meantime, if you really want it now, you’ll have to create the effect yourself by creating simple Parts in the “Grid” Layer, behind the Diagram.grid’s Part, of the appropriate size and position and number, and updated automatically in a “ViewportBoundsChanged” DiagramEvent listener.

Thanks for a quick answer!

One feature I was thinking of, that feels like a low-hanging fruit would be to be able to specify an offset as well as an interval for the shapes added to the grid.

Something similar to:

$(
      Panel,
      'Grid',
      { gridCellSize: new Size(12, 12) },
      $(Shape, 'BarH', { fill: 'white', height: 120, interval: 12, offset: 1 }),
      ...

Meaning that it would draw a 120px high bar, every 12th grid cell, starting at the cell with index 1 (instead of 0).

With a gray background, I could draw white bars horizontally and vertically, ending up with image above.

Another change would be to make gradient brushes be separate for each bar, and not span the entire viewport. In this case, I could create a white-gray-white brush or something similar for each bar.

We’ll fix a bug and slightly change the functionality of “Grid” Panels, in a manner that I believe is completely compatible with normal usage, so that you will be able to produce grids such as:

That will be coming out in the next release, which should be next week. But given all of the COVID-19 issues, it might be sometime after that.

Sounds great. Again, thanks for the quick and helpful response!

OK, with the release of 2.1.11, you can now use this code to achieve the screenshot that I showed above:

    var CELL = 20;
    myDiagram =
      $(go.Diagram, . . .,
          { . . .,
            grid:
              $(go.Panel, "Grid",
                { gridCellSize: new go.Size(CELL, CELL) },
                $(go.Shape, "LineH", { stroke: "whitesmoke", strokeWidth: 2*CELL, strokeDashArray: [CELL, (12-2)*CELL, CELL, 0], interval: 12 }),
                $(go.Shape, "LineH", { stroke: "lightgray", strokeWidth: 0.5 }),
                $(go.Shape, "LineV", { stroke: "lightgray", strokeWidth: 0.5 }),
                $(go.Shape, "LineH", { stroke: "gray", strokeWidth: 0.5, interval: 6 }),
                $(go.Shape, "LineV", { stroke: "gray", strokeWidth: 0.5, interval: 6 }),
                $(go.Shape, "LineH", { stroke: "gray", strokeWidth: 0.5, interval: 12 }),
                $(go.Shape, "LineV", { stroke: "gray", strokeWidth: 0.5, interval: 12 })
              )
          });

Works like a charm!

Again, thanks a lot! :-)