OK, here’s what I have so far. This produces:
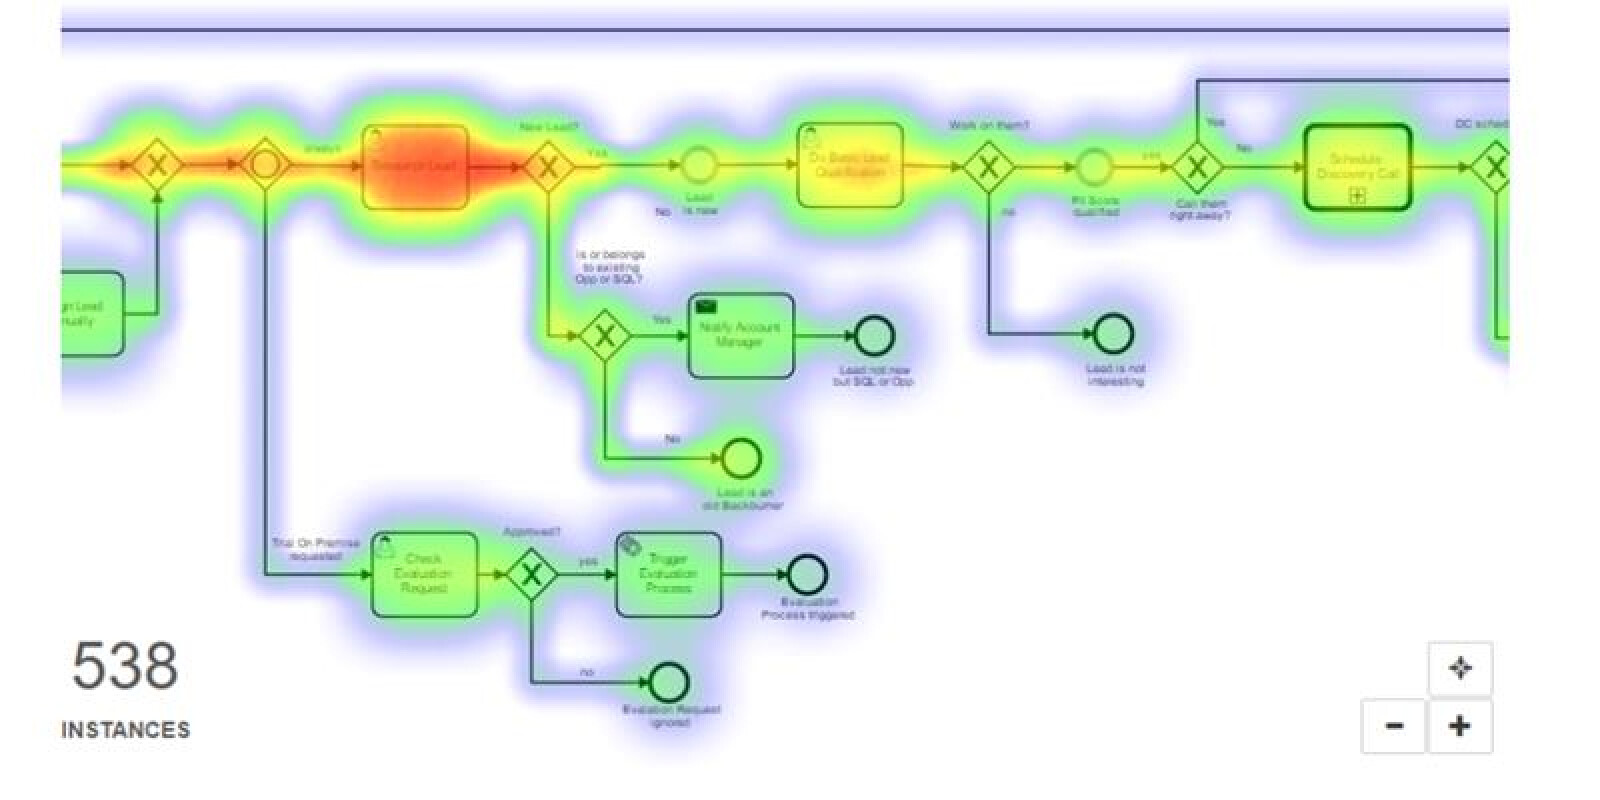
Note how when the user zooms out, areas merge together:
[EDIT: I have updated the code to fix some bugs and add some functionality]
<!DOCTYPE html>
<html>
<head>
  <title>Simple Heat Map</title>
  <!-- Copyright 1998-2026 by Northwoods Software Corporation. -->
</head>
<body>
  <div id="myDiagramDiv" style="border: solid 1px black; width:100%; height:400px"></div>
  <button id="myToggleButton">Toggle Heat Map</button>
  <button id="myRenderButton">Render Whole Doc at Half Scale</button>
  <textarea id="mySavedModel" style="width:100%;height:220px"></textarea>
  <canvas id="myImage" style="border: solid 1px black"></canvas>

  <script src="https://cdn.jsdelivr.net/npm/gojs"></script>
  <script id="code">

// This class adds a heat map image in the "ViewportForeground" Layer
// that is dynamically computed as the user scrolls or zooms or when
// a transaction/undo/redo is finished
class HeatMap {
  constructor(diagram, init) {
    this._heatMapPart =
      new go.Part({
          layerName: "ViewportForeground",
          alignment: go.Spot.TopLeft, alignmentFocus: go.Spot.TopLeft
        })
        .add(
          new go.Picture({ name: "IMG", element: document.createElement("canvas") })
        );
    this._colors =
      [ // this could be improved
        [0xFF, 0x45, 0x00, 200],  // orangered
        [0xFF, 0x65, 0x00, 200],
        [0xFF, 0x85, 0x00, 190],
        [0xFF, 0xA5, 0x00, 190],  // orange
        [0xFF, 0xC5, 0x00, 180],
        [0xFF, 0xE0, 0x00, 170],
        [0xFF, 0xFF, 0x00, 160],  // yellow
        [0xC0, 0xFF, 0x40, 150],
        [0xA0, 0xFF, 0x40, 140],
        [0x60, 0xFF, 0x20, 140],
        [0x00, 0xFF, 0x00, 130],  // lime
        [0x00, 0xCF, 0x40, 120],
        [0x00, 0xAF, 0x80, 110],
        [0x00, 0x8F, 0xA0, 100],
        [0x00, 0x4F, 0xC0, 80],
        [0x00, 0x4F, 0xFF, 70],  // blue
        [0x00, 0x4F, 0xFF, 50],
        [0x00, 0x4F, 0xFF, 20],
        [0x00, 0x4F, 0xFF, 10],
        [0x00, 0x4F, 0xFF, 5]
      ];
    this._updater = () => this.updateHeatMap();
    this._changer = e => { if (e.isTransactionFinished) this.updateHeatMap(); };
    if (diagram instanceof go.Diagram) {
      this.diagram = diagram;
      if (init) Object.assign(this, init);
    } else if (typeof diagram === "object") {
      Object.assign(this, diagram);
    }
  }

  // Gets or sets the Diagram that this HeatMap is working on.  The default is null.
  get diagram() { return this._diagram; }
  set diagram(value) {
    if (value !== this.diagram) {
      if (this.diagram) {
        this.diagram.removeDiagramListener("ViewportBoundsChanged", this._updater);
        this.diagram.removeModelChangedListener(this._changer);
        this.diagram.remove(this.heatMapPart);
      }
      this._diagram = value;
      if (this.diagram) {
        this.diagram.add(this.heatMapPart);
        this.diagram.addDiagramListener("ViewportBoundsChanged", this._updater);
        this.diagram.addModelChangedListener(this._changer);
        this.updateHeatMap();
      }
    }
  }

  // Gets or sets the Part that must be in a Layer.isViewportAligned Layer that holds
  // the raster image showing the computed heat map.
  get heatMapPart() { return this._heatMapPart; }
  set heatMapPart(value) {
    if (value !== this.heatMapPart) {
      if (this.heatMapPart && this.diagram !== null) this.diagram.remove(this.heatMapPart);
      this._heatMapPart = value;
      if (this.heatMapPart && this.diagram !== null) this.diagram.add(this.heatMapPart);
    }
  }

  // Gets or sets the Array of Array of RGBA color numbers to use in forming gradients.
  // Each Array representing a color must be different than the ones before it or after it.
  get colors() { return this._colors; }
  set colors(value) {
    if (!Array.isArray(value) || value.length < 2 || !value.every(a => Array.isArray(a) && a.length === 4 && a.every(n => typeof n === "number"))) {
      throw new Error("HeatMap.colors must be an Array of Array of four numbers, not: ", value);
    }
    this._colors = value;
    this.updateHeatMap();
  }

  // Override this method to customize getting the value for how "hot" the given Part is.
  // Typically this is overridden to return some numeric property of the Part.data.
  // By default it returns one, the maximum, assuming the normalizeTemperature method does not scale the value.
  getTemperature(part) {
    return 1;
  }

  // Override this method to shift and scale the given temperature to get a fraction between zero and one, inclusive.
  // A value of zero indicates that the given Part not participate in the heat map.
  // Values between zero and one select the starting color from the colors Array -- higher values get more colors.
  // By default it just returns the given value, making sure the value is between zero and one.
  normalizeTemperature(temp) {
    if (temp < 0) return 0;
    if (temp > 1) return 1;
    return temp;
  }

  // Override this method to customize the computation of the starting index in the colors Array
  // given the fraction computed by normalizeTemperature.
  // The default behavior is a simple linear interpolation.
  // The value must be a valid index into the colors Array.
  computeStartingColorIndex(frac) {
    const len1 = this.colors.length-1;
    let i = Math.round(len1 * (1-frac));
    if (i < 0) return 0;
    if (i > len1) return len1;
    return i;
  }

  // Return an ImageData of the given SIZE in pixels for the given AREA in document coordinates.
  renderImageData(canvas, area, size) {
    const diag = this.diagram;
    if (!diag) return;
    if (area.width < 1 || area.height < 1) return null;
    const w = Math.round(size.width);
    const h = Math.round(size.height);
    const scale = Math.min(w/area.width, h/area.height);
    return this._renderHeatMap(canvas, area, w, h, scale);
  }

  // Update the heatMapPart's raster image for the viewport.
  updateHeatMap() {
    const diag = this.diagram;
    if (!diag) return;
    if (diag.animationManager.isAnimating) return;
    if (!this.heatMapPart.isVisible()) return;
    const vb = diag.viewportBounds;
    const w = Math.round(vb.width * diag.scale);
    const h = Math.round(vb.height * diag.scale);
    const picture = this.heatMapPart.findObject("IMG");
    picture.width = vb.width;
    picture.height = vb.height;
    picture.scale = diag.scale;
    const canvas = picture.element;
    canvas.width = w;
    canvas.height = h;
    this._renderHeatMap(canvas, vb, w, h, diag.scale);
    picture.redraw();
  }

  _renderHeatMap(canvas, vb, w, h, sc) {
    const diag = this.diagram;
    if (!diag) return null;
    if (!vb.isReal()) return null;
    const ctx = canvas.getContext("2d");
    let imgdata = ctx.createImageData(w, h);
    const d = imgdata.data;
    const len1 = this.colors.length-1;
    let minColorIndex = Infinity;
    diag.findPartsIn(vb, true, false).each(part => {
      if (part instanceof go.Link) {
        //??? support for Bezier curves or other non-linear geometry
        if (part.computeCurve() === go.Curve.Bezier) return;
        if (part.pointsCount < 2) return;

        const b = part.routeBounds.copy();
        b.intersectRect(vb);
        if (b.width === 0 || b.height === 0) return;

        const frac = this.normalizeTemperature(this.getTemperature(part));
        if (frac <= 0) return;
        const startC = this.computeStartingColorIndex(frac);
        minColorIndex = Math.min(minColorIndex, startC);
        const SC = this.colors[startC];

        // ignore all labels and Link.corner and jump-overs
        let vp = part.getPoint(0).copy();
        vp.x = Math.round((vp.x - vb.x) * sc);
        vp.y = Math.round((vp.y - vb.y) * sc);

        for (let i = 1; i < part.pointsCount; i++) {
          const vq = part.getPoint(i).copy();
          vq.x = Math.round((vq.x - vb.x) * sc);
          vq.y = Math.round((vq.y - vb.y) * sc);
          if (vp.x === vq.x && vp.y === vq.y) continue;
          // draw points along straight line of route (no Bezier curves) from VP to VQ
          const m = (Math.abs(vq.x-vp.x) > Math.abs(vq.y-vp.y)) ? vq.x-vp.x : vq.y-vp.y;
          const am = Math.abs(m);
          const dx = (vq.x-vp.x)/am;
          const dy = (vq.y-vp.y)/am;
          for (let z = 0; z < am; z++) {
            const x2 = Math.round(vp.x + z*dx);
            if (x2 < 0 || x2 >= w) continue;
            const y2 = Math.round(vp.y + z*dy);
            if (y2 < 0 || y2 >= h) continue;
            const k2 = 4 * (y2 * w + x2);
            if (k2 >= 0 && k2 < d.length && d[k2+3] === 0) {
              d[k2] = SC[0];
              d[k2+1] = SC[1];
              d[k2+2] = SC[2];
              d[k2+3] = SC[3];
            }
          }
          vp = vq;
        }
      } else {
        const b = part.selectionObject.getDocumentBounds().copy();
        b.intersectRect(vb);
        if (b.width === 0 || b.height === 0) return;

        const frac = this.normalizeTemperature(this.getTemperature(part));
        if (frac <= 0) return;
        const startC = this.computeStartingColorIndex(frac);
        minColorIndex = Math.min(minColorIndex, startC);
        const SC = this.colors[startC];

        // assumes rectangular selectionObject?
        let tl = new go.Point(b.x, b.y);
        tl.x = Math.round((tl.x - vb.x) * sc);
        tl.y = Math.round((tl.y - vb.y) * sc);
        let br = new go.Point(b.right, b.bottom);
        br.x = Math.round((br.x - vb.x) * sc);
        br.y = Math.round((br.y - vb.y) * sc);

        for (let j = tl.y; j <= br.y; j++) {
          if (j < 0 || j >= h) continue;
          for (let i = tl.x; i <= br.x; i++) {
            if (i < 0 || i >= w) continue;
            const k = 4 * (j * w + i);
            if (k >= 0 && k < d.length && d[k+3] === 0) {
              d[k] = SC[0];
              d[k+1] = SC[1];
              d[k+2] = SC[2];
              d[k+3] = SC[3];
            }
          }
        }
      }
    });

    if (minColorIndex >= len1) return imgdata;
    let copydata = null;
    for (let i = minColorIndex; i < len1; i++) {
      const a = this.colors[i];
      const b = this.colors[i+1];
      if (copydata === null) copydata = new ImageData(imgdata.data, w, h);
      this._stepHeatMap(w, h, imgdata, a[0], a[1], a[2], a[3], copydata, b[0], b[1], b[2], b[3]);
      const temp = imgdata;
      imgdata = copydata;
      copydata = temp;
    }

    ctx.clearRect(0, 0, w, h);
    ctx.putImageData(imgdata, 0, 0);
    return imgdata;
  }

  // if an empty cell is next to a pRGBA cell, set it to nRGBA
  _stepHeatMap(w, h, imgdata, pr, pg, pb, pa, copydata, nr, ng, nb, na) {
    const d = imgdata.data;
    const c = copydata.data;
    // don't bother handling edge pixels
    for (let j = 1; j < h-1; j++) {
      for (let i = 1; i < w-1; i++) {
        const k = 4 * (j * w + i);
        if (d[k+3] !== 0) continue; // assume already set
        const w4 = 4 * w;
        if (d[k - w4] === pr && d[k - w4 + 1] === pg && d[k - w4 + 2] === pb && d[k - w4 + 3] === pa) {
          c[k] = nr; c[k+1] = ng; c[k+2] = nb; c[k+3] = na;
        } else if (d[k + w4] === pr && d[k + w4 + 1] === pg && d[k + w4 + 2] === pb && d[k + w4 + 3] === pa) {
          c[k] = nr; c[k+1] = ng; c[k+2] = nb; c[k+3] = na;
        } else if (d[k - 4] === pr && d[k - 4 + 1] === pg && d[k - 4 + 2] === pb && d[k - 4 + 3] === pa) {
          c[k] = nr; c[k+1] = ng; c[k+2] = nb; c[k+3] = na;
        } else if (d[k + 4] === pr && d[k + 4 + 1] === pg && d[k + 4 + 2] === pb && d[k + 4 + 3] === pa) {
          c[k] = nr; c[k+1] = ng; c[k+2] = nb; c[k+3] = na;
        }
      }
    }
  }
}


const myDiagram =
  new go.Diagram("myDiagramDiv", {
      layout: new go.ForceDirectedLayout(),
      "animationManager.isInitial": false,
      "undoManager.isEnabled": true,
      "ModelChanged": e => {     // just for demonstration purposes,
        if (e.isTransactionFinished) {  // show the model data in the page's TextArea
          document.getElementById("mySavedModel").textContent = e.model.toJson();
        }
      }
    });

const myHeatMap = new HeatMap(myDiagram, {
    getTemperature: part => part.data.value || 0  // temperature is determined by a data property
  });

document.getElementById("myToggleButton").addEventListener("click", e => {
  myHeatMap.heatMapPart.visible = !myHeatMap.heatMapPart.visible;
  if (myHeatMap.heatMapPart.visible) myHeatMap.updateHeatMap();
});

document.getElementById("myRenderButton").addEventListener("click", e => {
  const scale = 0.5;
  const b = myDiagram.documentBounds.copy();
  b.inflate(20, 20);  // margins for heat map highlighting
  const canvas = document.getElementById("myImage");
  const w = b.width = Math.round(b.width);
  const h = b.height = Math.round(b.height);
  const sw = w * scale;
  const sh = h * scale;
  canvas.width = sw;
  canvas.height = sh;
  const ctx = canvas.getContext("2d");
  ctx.clearRect(0, 0, w, h);
  // optionally draw the diagram itself in the background
  const diagdata = myDiagram.makeImageData({ position: b.position, size: b.size, scale: scale, returnType: "ImageData" });
  ctx.putImageData(diagdata, 0, 0);
  // draw the heatmap
  const canvas2 = new OffscreenCanvas(w, h);
  const imgdata = myHeatMap.renderImageData(canvas2, b, new go.Size(sw, sh));
  canvas2.getContext("2d").putImageData(imgdata, 0, 0);
  ctx.drawImage(canvas2, 0, 0);
});

myDiagram.nodeTemplate =
  new go.Node("Auto")
    .add(
      new go.Shape("RoundedRectangle", { fill: "lightgray" })
        .bind("fill", "color"),
      new go.TextBlock({ margin: 18 })
        .bind("text")
    );

myDiagram.linkTemplate =
  new go.Link({
      relinkableFrom: true, relinkableTo: true,
      reshapable: true, resegmentable: true,
      adjusting: go.LinkAdjusting.End
    })
    .add(
      new go.Shape({ strokeWidth: 2 }),
      new go.Shape({ toArrow: "OpenTriangle" })
    );

myDiagram.model = new go.GraphLinksModel(
[
  { key: 1, text: "Alpha", color: "lightblue", value: 1.0 },
  { key: 2, text: "Beta", color: "orange", value: 0.9 },
  { key: 3, text: "Gamma", color: "lightgreen", value: 0.5 },
  { key: 4, text: "Delta", color: "pink", value: 0.3 }
],
[
  { from: 1, to: 2, value: 1 },
  { from: 1, to: 3, value: 0.5 },
  { from: 2, to: 2, value: 1 },
  { from: 3, to: 4, value: 0.25 },
  { from: 4, to: 1, value: 0 }
]);
  </script>
</body>
</html>