Would it be possible to get sample data for the TreeMap diagram (Tree Map)?
Currently it’s a bit difficult to understand the relationships of the “nodes” as there is no sample data in the documentation. A simple/small nodeDataArray would suffice.
Would it be possible to get sample data for the TreeMap diagram (Tree Map)?
Currently it’s a bit difficult to understand the relationships of the “nodes” as there is no sample data in the documentation. A simple/small nodeDataArray would suffice.
That sample always generates a model with random data that it produces in the rebuildGraph function.
Try updating the input fields so that it only generates a model with 10 nodes and groups. (There are no links.) Then in the debugger console you can look at the model by looking at the value of myDiagram.model.nodeDataArray. That will be a JavaScript Array of 10 Objects. Take a look at a random Object in that Array. It will look like:
{
  fill: "#c5f18e",
  isGroup: true,
  key: 1,
  parent: 0,
  size: 2963.0618200845415,
  text: "1",
  total: 1080.365507131046
}
or like:
{
  fill: "#fbe9f4",
  isGroup: false,
  key: 5,
  parent: 1,
  size: 860.3698937126934,
  text: "5",
  total: 860.3698937126934
}
The key and isGroup and parent properties are all needed by the model to define the relationships between entities.
All of the other properties are specific to this sample. You’ll have to look at the implementation code to see how each of the properties are used, but you can guess what the size and total properties are for.
Okay that helps. However there’s still some issues.
I’ve used the sample on GitHub and tried to add text to it however all the normal GOJS conventions for aligning the content within a ‘node’ seem to not function. Any advice?
For example given that the nodes are dynamic in width and height how do I make a box within the node span the entire width/height of the node? At the very least how do I center content within the node? I’ve attempted to use the alignment property to no avail.
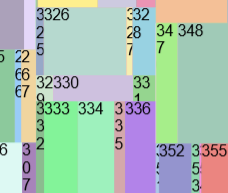
That Tree Map sample uses absolutely the simplest kind of node, as you can see by the template:
    // Nodes and Groups are the absolute minimum template: no elements at all!
    myDiagram.nodeTemplate =
      $(go.Node,
        { background: "rgba(99,99,99,0.2)" },
        new go.Binding("background", "fill"),
        {
          toolTip: $("ToolTip",
            $(go.TextBlock, new go.Binding("text", "", tooltipString).ofObject())
          )
        }
      );
Although the tooltip helps let people see some text for each colored rectangle.
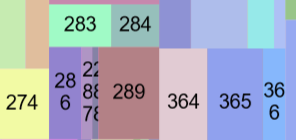
The first thing to try is to just add a TextBlock to the node template:
    myDiagram.nodeTemplate =
      $(go.Node,
        { background: "rgba(99,99,99,0.2)" },
        new go.Binding("background", "fill"),
        $(go.TextBlock,
          new go.Binding("text")),
        {
          toolTip: $("ToolTip",
            $(go.TextBlock, new go.Binding("text", "", tooltipString).ofObject())
          )
        }
      );
You can see that when TreeMapLayout.layoutNode sets the node’s desiredSize, it causes the text of the TextBlock to maybe wrap and maybe be clipped, depending on the given width and height.
You can then change the Node’s Panel type to be “Auto”, so that it aligns the TextBlock in the middle (by default) and also forces the text to wrap and clip:
      $(go.Node, "Auto",
        $(go.Shape, { fill: "rgba(99,99,99,0.2)", strokeWidth: 0 },
          new go.Binding("fill")),
        $(go.TextBlock,
          new go.Binding("text")),
        {
          toolTip: $("ToolTip",
            $(go.TextBlock, new go.Binding("text", "", tooltipString).ofObject())
          )
        }
      )
Read more about TextBlocks and Panels and Nodes at:
https://gojs.net/latest/intro/textBlocks.html
https://gojs.net/latest/intro/panels.html
https://gojs.net/latest/intro/nodes.html
I’ve updated the last template to be simpler. It now uses a regular “Auto” Panel to arrange the TextBlock in the middle. When an “Auto” panel gets given a size, it fits the contents (i.e. the TextBlock) in the panel, clipping it if needed.
Note the change from binding the Node.background to binding the Shape.fill.
