How can i achieve click events on the graph (chartjs) in the Node ?
As i have applied the click event in the chartjs but it doesn’t triggered.
https://gojs.net/latest/samples/canvases.html
Define a click event handler on the Picture or on the Node.
https://gojs.net/latest/intro/events.html#HigherLevelInputEvents
Thanks for your prompt reply Walter. This works fine but what i want is to click on the series on the chart that is native chart.js click events.
I shouldn’t be up now, so I’m not going to implement something for you.
The idea is that you could have a single DIV holding a chart.js graph that is positioned (and sized?) to be just like the Picture showing a chart in a Node. The click event handler could position that DIV, which has a z-order such that it is in front of the diagram’s DIV, so that it exactly overlaps the Picture in the Node. And you set that chart.js graph to show the same data that is shown in the node.
When the user clicks elsewhere, you hide that DIV with the chart.js chart.
Thank you Walter, But doesn’t make bad UX ? Is there any other alternative way ? to achieve.
How would that be bad? If you have a thousand nodes in your diagram, you wouldn’t want there to be a thousand instances of HTMLDivElements with their corresponding chart components.
ok Walter, let me try the idea to create the chart and position over the chart with mouseOver event and destroy when mouseOut.
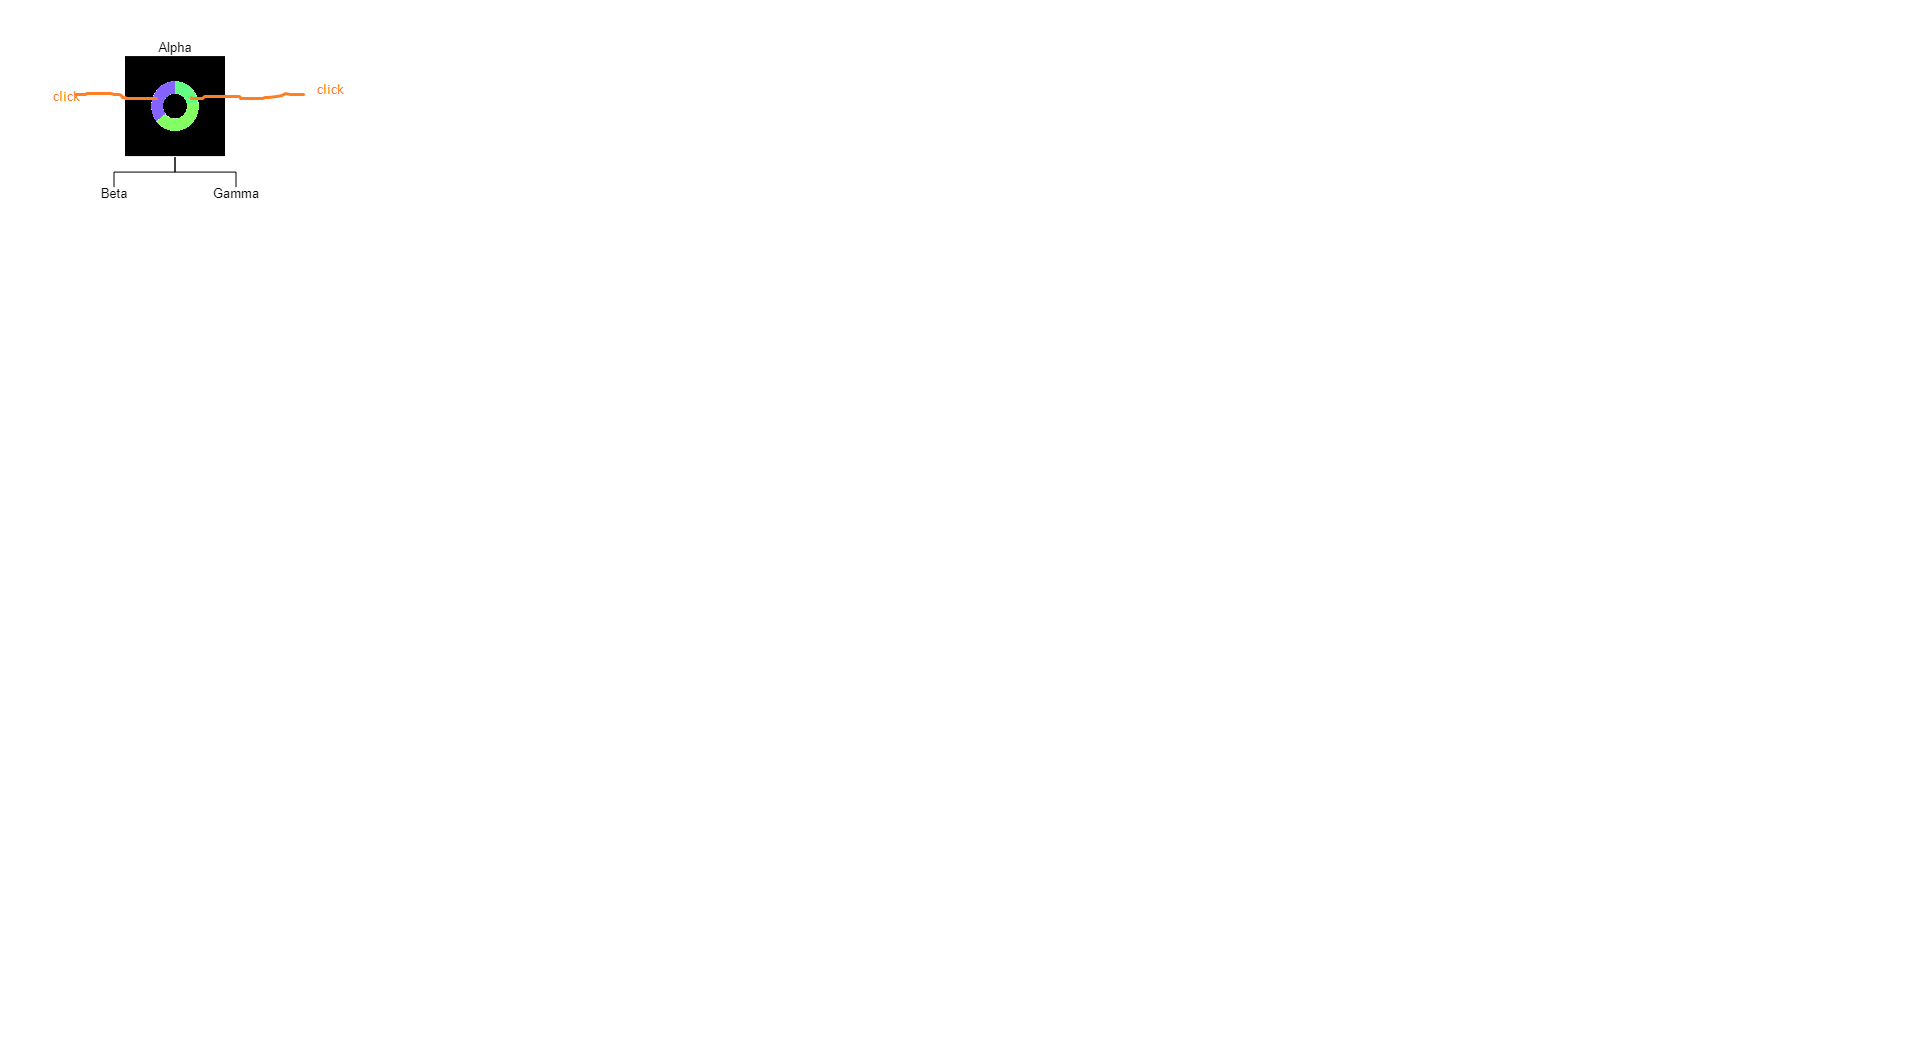
HI Walter, As said i have render the chart on mouseOver Event of the GraphObj, Which is working fine for me. But i couldn’t able to place the chart in the exact position of the Node.
$$(go.Panel, “Vertical”, {
                    }, $$(go.Picture, {
                            width: 80,
                            height: 50,
                            margin: 0,

                        },
                        new go.Binding("element", "chart",
                        makeChart), { // here E is the InputEvent and OBJ is this Shape
                            mouseEnter: function (e, obj) {

                                var loc = obj.part.location;
                                var docloc = myDiagram.transformDocToView(obj.part.location);

                                makeChartOver(docloc.x, docloc.y);

                            },
                            mouseLeave: function (e, obj) {
                              //..
                            },
                            click: function (e, obj) {
                                //..
                            },

                        }
                    ),


                )
can you please assist where i have done mistake.
GoJS Coordinate Systems-- Northwoods Software talks about coordinate systems.
Call GraphObject | GoJS API on the particular Picture to get its area in document coordinates.
Convert that Rect.position to viewport coordinates by calling Diagram | GoJS API
There are several samples that demonstrate positioning some HTML, such as Data Visualization GoJS Sample
And it is also shown at GoJS HTML Interaction -- Northwoods Software
Thank you Walter