Have anyone managed to do something like this before?
Thanks.
Just create separate Parts holding vertical lines and Parts holding those labels.
Did you want those to shift as the user resized the timeline? If so, the layout has to know about them.
I can extend the sample for you later today.
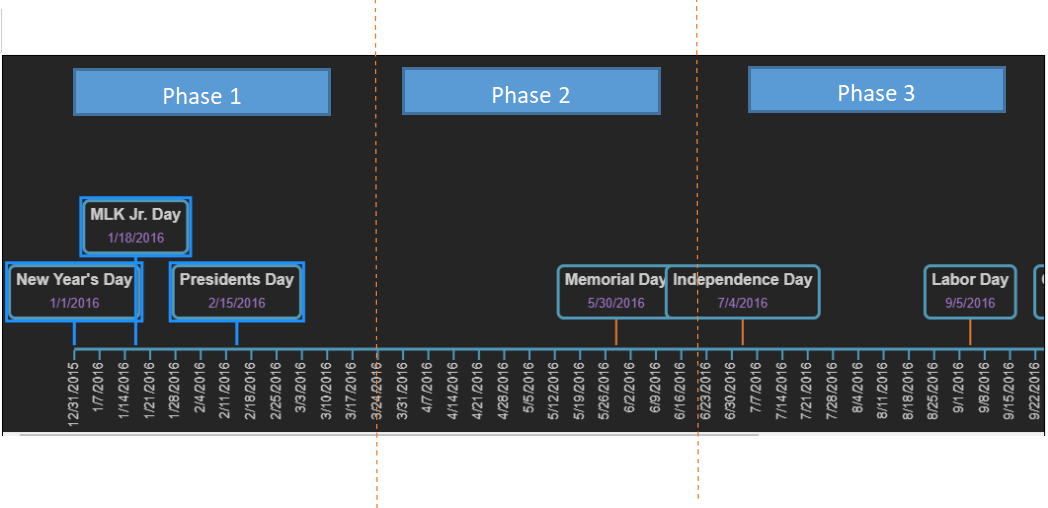
I’m a bit busy now, but here’s the modified Timeline sample showing labels for “phases”, but without the vertical separator lines:
[EDIT: sample code replaced by enhanced sample at: Zoomable Timeline with Phases]
Thanks for the sample. It really helps. I’m still new in GoJS. How do I create the vertical line? I’ve tried google about it but haven’t found it yet.
Here you go: Zoomable Timeline with Phases
As always, the complete source code is in the page itself.
Thanks for the sample. Really appreciate it.
How do I update the data when the event drag to other date?
The sample depends on TimelineLayout to position nodes according to their node.data.date.
If you want to support users moving nodes, you need to implement a mechanism that calls Model.set on the Node.data with the new Date when a Node has moved. One way is to implement a “SelectionMoved” DiagramEvent listener. Call Panel | GoJS API with each moved Node.location and valueToDate.
Thanks for your help.
Hi Walter,
Just want to ask, about the above sample given, will it be a straight forward conversion to angular?
Thanks.
If you are familiar with Angular, I do not see any reason why it would be difficult.
I hope you have read GoJS and Angular -- Northwoods Software
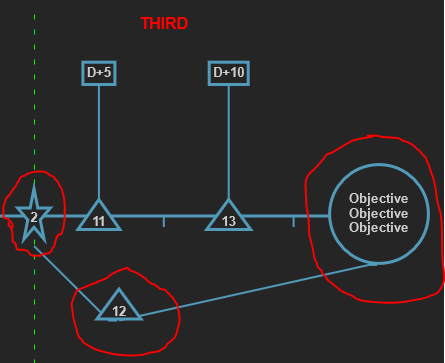
Ok. I’ll try that later. However I need your help a bit regarding the link. I want the link to connect to the center of a node. Based on the screenshot given, I want that link end point to be placed at the center of the shape not bottom. I’ve tried based on the example related to fromSpot and toSpot but failed to achieved that. Hope you can help me.
Make sure you do not set either fromSpot and toSpot.
I’ve removed fromSpot and toSpot but still not working. Is there any prob with my code?
myDiagram.nodeTemplate =
  $(go.Node, "Table",
    { locationSpot: go.Spot.Center, dragComputation: stayInViewport },
    new go.Binding("movable", "type", (e) => {
          if(e === "dp" || e === "objective")
            return true;
          else
            return false;
        }),
    $(go.Panel, "Auto",
      $(go.Shape,
        { fill: "#252526", stroke: "#519ABA", strokeWidth: 3 },
        new go.Binding("figure", "type", (e) => {
          if(e === "dp")
            return "Triangle";
          else if(e === "dd")
            return "Rectangle";
          else if(e === "cdp")
            return "FivePointedStar";
          else if(e === "objective")
            return "Circle";
        }),
        new go.Binding("height", "type", (e) => {
          if(e === "dp")
            return 30;
        }),
        new go.Binding("radius", "type", (e) => {
          if(e === "dp")
            return 40;
          else if(e === 'cdp')
            return 50;
          else if(type === "dd")
            return 60;
          /*else if(e === "objective")
            return 100; */
        })
      ),
      $(go.Panel, "Table",
        $(go.TextBlock,
          {
            row: 0,
            stroke: "#CCCCCC",
            wrap: go.TextBlock.WrapBreakAll,
            font: "bold 10pt sans-serif",
            textAlign: "center", margin: 4
          },
          new go.Binding("text", "name")
        )
      )
    )
  );```