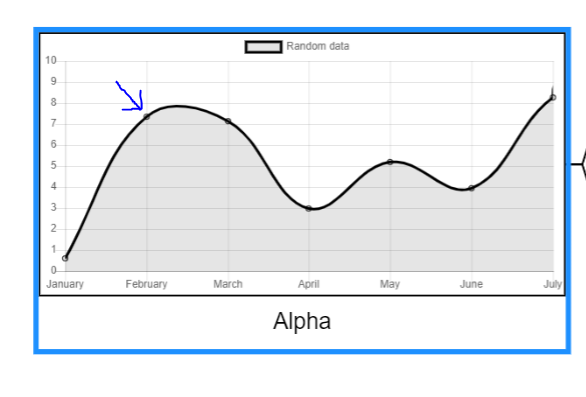
Is it possible to change the shape of data points “dot” to other shapes(means I want to insert small icons instead of dots)?

Is it possible to change the shape of data points “dot” to other shapes(means I want to insert small icons instead of dots)?
It looks like you’re starting from the Canvases sample. That sample uses Chart.js to generate those graphs, so you’ll need to look into styling there, not within GoJS.