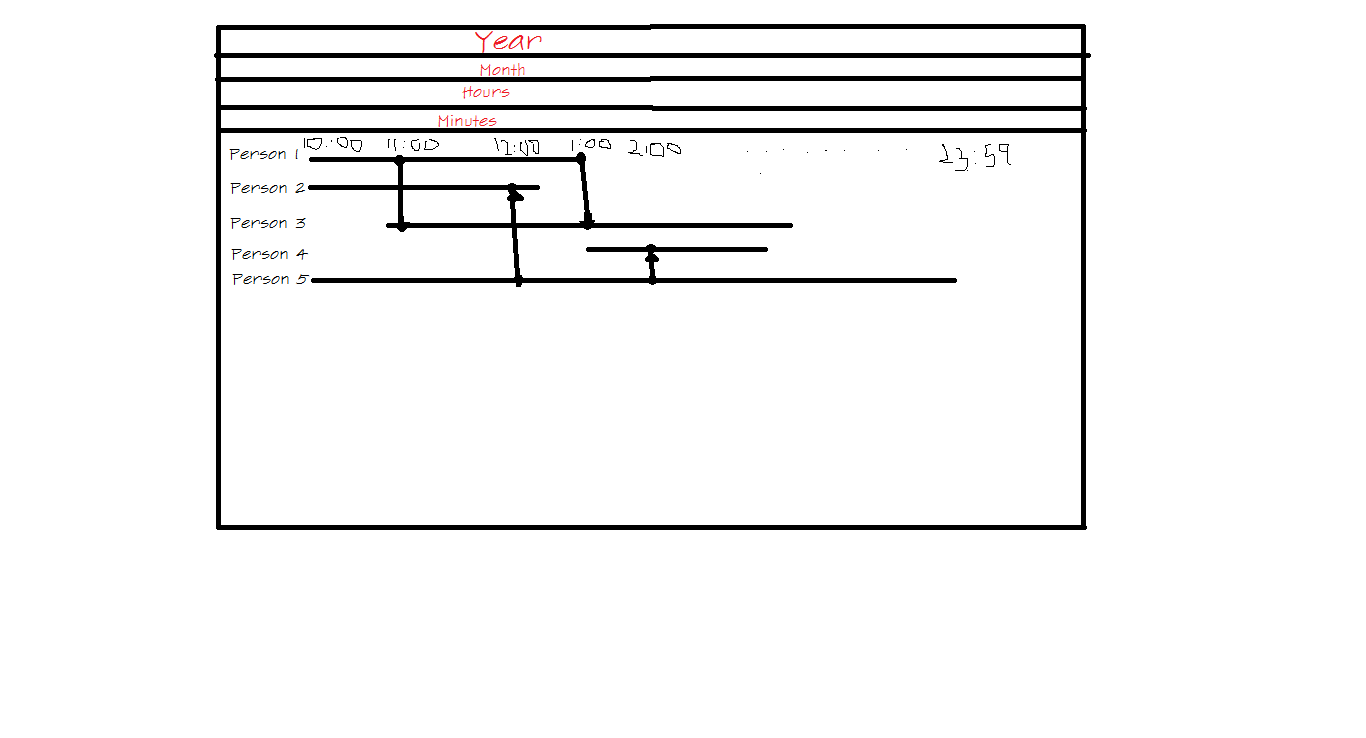
Can you please provide sample for creating timeline chart with time scale on top . as shown in image.
Reagards
Can you please provide sample for creating timeline chart with time scale on top . as shown in image.
Reagards
I’m sorry, but unlike GoDiagram, GoXam does not have such a control.
You can use GridPatterns to create a visual grid of regular lines or rectangles, but you’ll need to implement the text yourself using the normal WPF mechanisms.
Can you provde me sample for start. As i cant get from where to start.
Regards
I haven’t tried this code in a long time, but you could try what is in http://goxam.com/temp/rulers.zip.
Can you please help me to scale it with date and time?
Regards
Sorry, but I don’t have time today.
Try it As soon as possible
Have you got any sample ?
No, sorry, but I do not.