I want to make a navigation panel of my nodes and groups, but I can’t find any method to expand the groups separately.
example:
Any idea how to do it?
I want to make a navigation panel of my nodes and groups, but I can’t find any method to expand the groups separately.
example:
Any idea how to do it?
You can call expand/collapseSubGraph if you already have a reference to the group. I’m not sure how your data looks or what you’ve implemented so far.
var nodeDataArray = [
	{"key":"input", "text":"INPUT", "category":"nodoExtremo", "color":"coral", "loc":{"class":"go.Point", "x":292.7257143932125, "y":0}},
	{"key":"bts1", "text":"BTS1", "group":"cluster3", "category":"nodoHijo", "color":"pink", "loc":{"class":"go.Point", "x":153.49214292880833, "y":294.9638429288081}},
	{"key":"bts2", "text":"BTS2", "group":"cluster3", "category":"nodoHijo", "color":"pink", "loc":{"class":"go.Point", "x":223.47814292880832, "y":294.9638429288081}},
	{"key":"bts3", "text":"BTS3", "group":"cluster3", "category":"nodoHijo", "color":"pink", "loc":{"class":"go.Point", "x":153.49214292880833, "y":364.94984292880844}},
	{"key":"bts4", "text":"BTS4", "group":"cluster4", "category":"nodoHijo", "color":"pink", "loc":{"class":"go.Point", "x":514.9426858576164, "y":314.30509061334686}},
	{"key":"csr1", "text":"CSR1", "group":"cluster1", "category":"nodoNormal", "color":"cornflowerblue", "loc":{"class":"go.Point", "x":127.49734292880821, "y":174.68790292880823}},
	{"key":"csr2", "text":"CSR2", "group":"cluster1", "category":"nodoNormal", "color":"cornflowerblue", "loc":{"class":"go.Point", "x":204.0048858576165, "y":174.68790292880823}},
	{"key":"csr3", "text":"CSR3", "group":"cluster2", "category":"nodoNormal", "color":"cornflowerblue", "loc":{"class":"go.Point", "x":488.94788585761665, "y":194.0291506133467}},
	{"key":"hr1", "text":"HR1", "group":"cluster5", "category":"nodoNormal", "color":"cornflowerblue", "loc":{"class":"go.Point", "x":30.993799999999997, "y":124.39796292880828}},
	{"key":"hr2", "text":"HR2", "group":"cluster6", "category":"nodoNormal", "color":"cornflowerblue", "loc":{"class":"go.Point", "x":392.4443429288083, "y":124.39796292880828}},
	{"key":"mr2", "text":"MR2", "group":"cluster2", "category":"nodoNormal", "color":"cornflowerblue", "loc":{"class":"go.Point", "x":565.4554287864247, "y":194.0291506133467}},
	{"key":"cluster3", "text":"CLUSTER3", "isGroup":true, "category":"GrupoPanel", "color":"lightgray", "group":"cluster1", "loc":{"class":"go.Point", "x":128.49734292880825, "y":269.9739029288083}},
	{"key":"cluster1", "text":"CLUSTER1", "isGroup":true, "category":"GrupoPanel", "color":"lightgray", "group":"cluster5", "loc":{"class":"go.Point", "x":102.50254292880827, "y":149.6979629288083}},
	{"key":"cluster5", "text":"CLUSTER5", "isGroup":true, "category":"grupoPrincipal", "color":"rgba(255,0,0,0.2)", "loc":{"class":"go.Point", "x":1, "y":104.40754292880828}},
	{"key":"cluster4", "text":"CLUSTER4", "isGroup":true, "category":"GrupoPanel", "color":"lightgray", "group":"cluster2", "loc":{"class":"go.Point", "x":489.9478858576166, "y":289.3151506133468}},
	{"key":"cluster2", "text":"CLUSTER2", "isGroup":true, "category":"GrupoPanel", "color":"lightgray", "group":"cluster6", "loc":{"class":"go.Point", "x":463.9530858576166, "y":149.6979629288083}},
	{"key":"cluster6", "text":"CLUSTER6", "isGroup":true, "category":"grupoPrincipal", "color":"rgba(255,0,0,0.2)", "loc":{"class":"go.Point", "x":362.45054292880826, "y":104.40754292880828}},
	{"key":"output", "text":"OUTPUT", "category":"nodoExtremo", "color":"coral", "loc":{"class":"go.Point", "x":120.9758, "y":512.9202429288084}}
];

linkDataArray = [
	{"from":"input", "to":"hr1", "text":"1000", "utilization":"0.10939979661202281", "color":"black", "category":"lineaFlaca", "fromPort":"bot", "toPort":"top"},
	{"from":"input", "to":"hr2", "text":"1000", "utilization":"0.5475690504158087", "color":"black", "category":"lineaFlaca", "fromPort":"bot", "toPort":"top"},
	{"from":"hr1", "to":"csr1", "text":"1000", "utilization":"0.7315199718656241", "color":"black", "category":"lineaFlaca", "fromPort":"bot", "toPort":"top"},
	{"from":"hr1", "to":"csr2", "text":"1000", "utilization":"0.27227367392917556", "color":"black", "category":"lineaFlaca", "fromPort":"bot", "toPort":"top"},
	{"from":"csr1", "to":"bts1", "text":"100", "utilization":"0.08284848212118323", "color":"black", "category":"lineaFlaca", "fromPort":"bot", "toPort":"top"},
	{"from":"csr1", "to":"bts2", "text":"100", "utilization":"0.8758963722348141", "color":"black", "category":"lineaFlaca", "fromPort":"bot", "toPort":"top"},
	{"from":"csr2", "to":"bts3", "text":"100", "utilization":"0.7061938648815218", "color":"black", "category":"lineaFlaca", "fromPort":"bot", "toPort":"top"},
	{"from":"bts1", "to":"output", "text":"50", "utilization":"0.3517356500330784", "color":"black", "category":"lineaFlaca", "fromPort":"bot", "toPort":"top"},
	{"from":"bts2", "to":"output", "text":"50", "utilization":"0.2672914733633833", "color":"black", "category":"lineaFlaca", "fromPort":"bot", "toPort":"top"},
	{"from":"bts3", "to":"output", "text":"50", "utilization":"0.9297544000674943", "color":"black", "category":"lineaFlaca", "fromPort":"bot", "toPort":"top"},
	{"from":"hr2", "to":"mr2", "text":"100", "utilization":"0.5507539761135395", "color":"black", "category":"lineaFlaca", "fromPort":"bot", "toPort":"top"},
	{"from":"mr2", "to":"csr3", "text":"100", "utilization":"0.17060925659391857", "color":"black", "category":"lineaFlaca", "fromPort":"bot", "toPort":"top"},
	{"from":"csr3", "to":"bts4", "text":"50", "utilization":"0.5261097892787039", "color":"black", "category":"lineaFlaca", "fromPort":"bot", "toPort":"top"},
	{"from":"bts4", "to":"output", "text":"50", "utilization":"0.0745158089851804", "color":"black", "category":"lineaFlaca", "fromPort":"bot", "toPort":"top"}
];


myDiagram = $(go.Diagram, 'myDiagramDiv', {
    layout: $(go.TreeLayout,
            { angle: 90, nodeSpacing: 10, layerSpacing: 30 })
});


myDiagram.groupTemplateMap.add('GrupoPanel',
	$(go.Group, "Auto", new go.Binding("location", "loc").makeTwoWay(),
		{
	        ungroupable: true,
	        mouseDragEnter: function(e, grp, prev) { highlightGroup(e, grp, true); },
	        mouseDragLeave: function(e, grp, next) { highlightGroup(e, grp, false); },
	        computesBoundsAfterDrag: true,
	        mouseDrop: finishDrop,
	        handlesDragDropForMembers: true
		}, new go.Binding("background", "isHighlighted", function(h) { return h ? "rgba(255,0,0,0.2)" : "transparent"; }).ofObject(),
		$(go.Shape, "Rectangle", { fill: null, stroke: "gray" },  new go.Binding('fill','color')),
		$(go.Panel, "Table", { margin: 0.5 },
			$(go.RowColumnDefinition, { row: 0, background: "white" }),
			$("SubGraphExpanderButton", { row: 0, column: 0, margin: 3 }),
			$(go.TextBlock, { margin: 5, row: 0, column: 1, font: "bold 13px Sans-Serif", stroke: "black", textAlign: "left", stretch: go.GraphObject.Horizontal } ,
				new go.Binding("text")
			),
			$(go.Placeholder, { row: 1, columnSpan: 2, padding: 50, alignment: go.Spot.TopLeft },
				new go.Binding("padding", "isSubGraphExpanded",
                    function(exp) {
						return exp ? 25 : 10;
					}
				).ofObject()
			)
		)
	)
);

myDiagram.groupTemplateMap.add("grupoPrincipal",
    $(go.Group, "Auto", new go.Binding("location", "loc").makeTwoWay(),
      {
        ungroupable: true,
        mouseDragEnter: function(e, grp, prev) { highlightGroup(e, grp, true); },
        mouseDragLeave: function(e, grp, next) { highlightGroup(e, grp, false); },
        computesBoundsAfterDrag: true,
        mouseDrop: finishDrop,
        handlesDragDropForMembers: true
      },
      new go.Binding("background", "isHighlighted", function(h) { return h ? "rgba(255,0,0,0.2)" : "transparent"; }).ofObject(),
      $(go.Shape, "Rectangle",
        { fill: null, stroke: "#33D3E5", strokeWidth: 2 }),
      $(go.Panel, "Vertical",
        $(go.Panel, "Horizontal",
          { stretch: go.GraphObject.Horizontal, background: "#33D3E5" },
          $("SubGraphExpanderButton",
            { alignment: go.Spot.Center, margin: 5 }),
          $(go.TextBlock,
            {
              alignment: go.Spot.Center,
              editable: false,
              margin: 5,
              font: "bold 15px sans-serif",
              opacity: 0.75,
              stroke: "#404040"
            },
            new go.Binding("text", "text").makeTwoWay())
        ),  // end Horizontal Panel
        $(go.Placeholder,
          { padding: new go.Margin(20,30) , alignment: go.Spot.Center })
      )
    )
);

myDiagram.nodeTemplateMap.add("nodoExtremo",
	$(go.Node, 'Auto',  new go.Binding("location", "loc").makeTwoWay(),
		$(go.Shape, 'RoundedRectangle', {fill: 'coral'},  new go.Binding('fill','color')),
		$(go.TextBlock, "text", {margin: new go.Margin(7, 10), font: 'bold 16pt Segoe UI, sans-serif'},
			new go.Binding('text', 'text'),
			{contextMenu: menu}
		),
		getPortTop('top'), getPortLeft('left'),	getPortBottom('bottom'), getPortRight('right')
	)
);

myDiagram.nodeTemplateMap.add("nodoNormal",
	$(go.Node, 'Auto',  new go.Binding("location", "loc").makeTwoWay(),
		$(go.Shape, 'RoundedRectangle', {fill: 'cornflowerblue'},
			new go.Binding('fill', 'color')
		),
		$(go.TextBlock, "text", {margin: new go.Margin(8, 10), font: '10pt Segoe UI, sans-serif'},
			new go.Binding('text', 'text'),
			{contextMenu: menu}
		),
		getPortTop('top'), getPortLeft('left'),	getPortBottom('bottom'), getPortRight('right')
	)
);

myDiagram.linkTemplateMap.add("lineaFlaca",
	$(go.Link,
		$(go.Shape, { strokeWidth:  2, segmentOffset: new go.Point(10000, 10000)},
			new go.Binding('stroke', 'color')
		),
		$(go.Shape, { toArrow: 'Standard', stroke: null, segmentOffset: new go.Point(0, 0) },
			new go.Binding('fill', 'color')
		),
	    $(go.TextBlock, { segmentOffset: new go.Point(0, 15) },
	    	new go.Binding("text", "text")
	    )
	)
);

myDiagram.model =  $(go.GraphLinksModel,  {
	linkFromPortIdProperty: "fromPort",
	linkToPortIdProperty: "toPort",
    nodeDataArray,
    linkDataArray
});
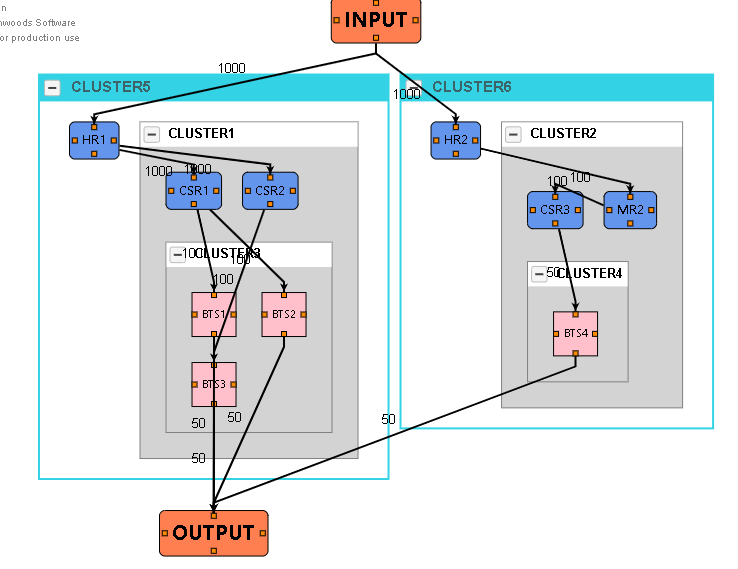
With that code I get the following:
omitted the largest amount of junk code so it wouldn’t be so confusing
I only have that, I still have to create the left panel that I planted in the example, but I can’t find the methods to be able to expand the groups individually.
When you say expand individually, do you mean you want the left and right diagrams to be in sync? So expanding a group in the left also expands it in the right?
Yes, exactly.
at the moment I found a way to expand the model but by grouping levels and all the groups expand simultaneously depending on the level, but it is not what I am looking for
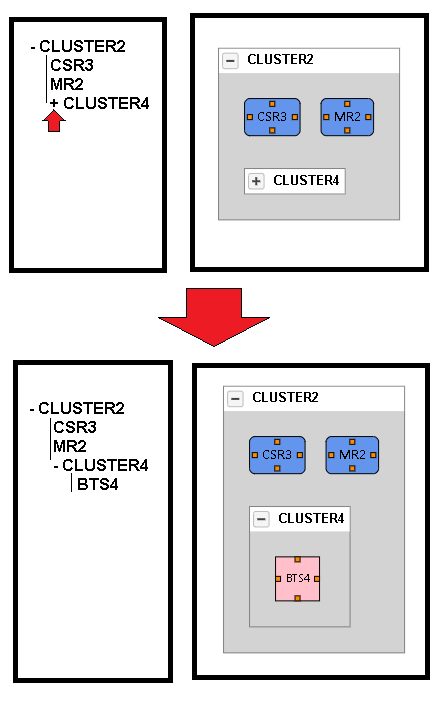
Ok, here’s a sample that I think does what you want. It has two diagrams that share the same model, and the left diagram uses a group template that lays out the subgraph like a tree view. Note that both group template use a two way binding on “isSubGraphExpanded” such that a change in either diagram will be reflected in the other. Let us know if this is what you’re looking for.
Thank you very much for everything, it is exactly what I needed.