OK, here’s a sample that demonstrates that the behavior that I think you want regarding the routing of links when groups are collapsed. This is the default behavior – I haven’t done anything special.
<!DOCTYPE html>
<html>
<head>
<title>Click-collapsing Groups</title>
<!-- Copyright 1998-2020 by Northwoods Software Corporation. -->
<meta charset="UTF-8">
<script src="go.js"></script>
<script id="code">

// copied from extensions/Figures.js:
go.Shape.defineFigureGenerator("Ethernet", function(shape, w, h) {
  var geo = new go.Geometry();
  var fig = new go.PathFigure(.35 * w, 0, true);
  geo.add(fig);
  // Boxes above the wire
  fig.add(new go.PathSegment(go.PathSegment.Line, .65 * w, 0));
  fig.add(new go.PathSegment(go.PathSegment.Line, .65 * w, .4 * h));
  fig.add(new go.PathSegment(go.PathSegment.Line, .35 * w, .4 * h));
  fig.add(new go.PathSegment(go.PathSegment.Line, .35 * w, 0).close());
  var fig2 = new go.PathFigure(.10 * w, h, true, true);
  geo.add(fig2);
  // Boxes under the wire
  fig2.add(new go.PathSegment(go.PathSegment.Line, .40 * w, h));
  fig2.add(new go.PathSegment(go.PathSegment.Line, .40 * w, .6 * h));
  fig2.add(new go.PathSegment(go.PathSegment.Line, .10 * w, .6 * h));
  fig2.add(new go.PathSegment(go.PathSegment.Line, .10 * w, h).close());
  var fig3 = new go.PathFigure(.60 * w, h, true, true);
  geo.add(fig3);
  fig3.add(new go.PathSegment(go.PathSegment.Line, .90 * w, h));
  fig3.add(new go.PathSegment(go.PathSegment.Line, .90 * w, .6 * h));
  fig3.add(new go.PathSegment(go.PathSegment.Line, .60 * w, .6 * h));
  fig3.add(new go.PathSegment(go.PathSegment.Line, .60 * w, h).close());
  var fig4 = new go.PathFigure(0, .5 * h, false);
  geo.add(fig4);
  // Wire
  fig4.add(new go.PathSegment(go.PathSegment.Line, w, .5 * h));
  fig4.add(new go.PathSegment(go.PathSegment.Move, .5 * w, .5 * h));
  fig4.add(new go.PathSegment(go.PathSegment.Line, .5 * w, .4 * h));
  fig4.add(new go.PathSegment(go.PathSegment.Move, .75 * w, .5 * h));
  fig4.add(new go.PathSegment(go.PathSegment.Line, .75 * w, .6 * h));
  fig4.add(new go.PathSegment(go.PathSegment.Move, .25 * w, .5 * h));
  fig4.add(new go.PathSegment(go.PathSegment.Line, .25 * w, .6 * h));
  return geo;
});


  function init() {
    var $ = go.GraphObject.make;
    myDiagram =
      $(go.Diagram, "myDiagramDiv",
        {
          layout: $(go.TreeLayout, { setsPortSpot: false, setsChildPortSpot: false }),
          "undoManager.isEnabled": true
        });

    myDiagram.groupTemplate =
      $(go.Group, "Vertical",
        { layout: $(go.TreeLayout, { setsPortSpot: false, setsChildPortSpot: false }) },
        $(go.Panel, "Auto",
          // clicking on the group's body collapses or expands the group
          { click: function(e, obj) {
              var grp = obj.part;
              if (grp.isSubGraphExpanded) {
                grp.diagram.commandHandler.collapseSubGraph(grp);
              } else {
                grp.diagram.commandHandler.expandSubGraph(grp);
              }
            } },
          // the background shape for the Group is either a Rectangle or an Ellipse, depending on data.round
          $(go.Shape, { fill: "lavender", stroke: "red" },
            new go.Binding("figure", "round", function(b) { return b ? "Ellipse" : "Rectangle"; })),
          $(go.Panel,
            // this occupies the area covered by the subgraph Parts
            $(go.Placeholder, { padding: 15 }),
            // this substitute Shape is only shown when the Group is not expanded
            $(go.Shape, "Ethernet", { width: 50, height: 50 },
              new go.Binding("visible", "isSubGraphExpanded", function(b) { return !b; }).ofObject()))),
        $(go.TextBlock,
          new go.Binding("text", "key")));

    myDiagram.nodeTemplate =
      $(go.Node, "Vertical",
        new go.Binding("location", "loc", go.Point.parse),
        $(go.Picture, { width: 50, height: 60 },
          new go.Binding("source", "type", function(t) { return "https://gojs.net/latest/samples/images/" + t; })),
        $(go.TextBlock,
          new go.Binding("text", "key"))
      );

    myDiagram.linkTemplate =
      $(go.Link,
        $(go.Shape, { stroke: "slateblue", strokeWidth: 2 }),
        $(go.Shape, { toArrow: "Standard" }),
        // a textual label on the Link, offset so that its top is centered on the Link's route
        $(go.TextBlock, { alignmentFocus: go.Spot.Top },
          new go.Binding("text")));

    myDiagram.model.nodeDataArray = [
      { key: "Group1", isGroup: true, group: "Group0" },
      { key: "Node2", group: "Group1", type: "60x90.png", annot: "W1C", loc: "0 50" },
      { key: "Node3", group: "Group1", type: "55x55.png", loc: "100 100" },
      { key: "Group4", isGroup: true, round: true },
      { key: "Node5", group: "Group4", type: "50x40.png", loc: "250 50" },
      { key: "Node6", group: "Group4", type: "80x50.png", loc: "400 100" },
      { key: "Group7", isGroup: true, round: true },
      { key: "Node8", group: "Group7", type: "60x90.png", loc: "0 50" },
      { key: "Node9", group: "Group7", type: "80x50.png", loc: "100 100" }
    ];

    myDiagram.model.linkDataArray = [
      { from: "Node5", to: "Node2", text: "link7" },
      { from: "Node6", to: "Node3", text: "link8" },
      { from: "Node5", to: "Node8", text: "link9" },
      { from: "Node6", to: "Node8", text: "link10" }
    ];
  }
</script>
</head>
<body onload="init()">
  <div id="myDiagramDiv" style="border: solid 1px blue; width:100%; height:700px; min-width: 200px"></div>
  Click on a Group to collapse or expand it.
</body>
</html>
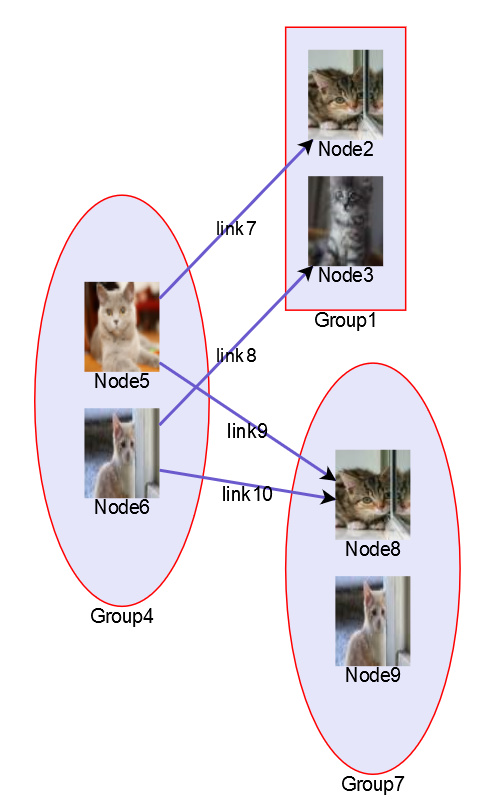
So the diagram starts off as:
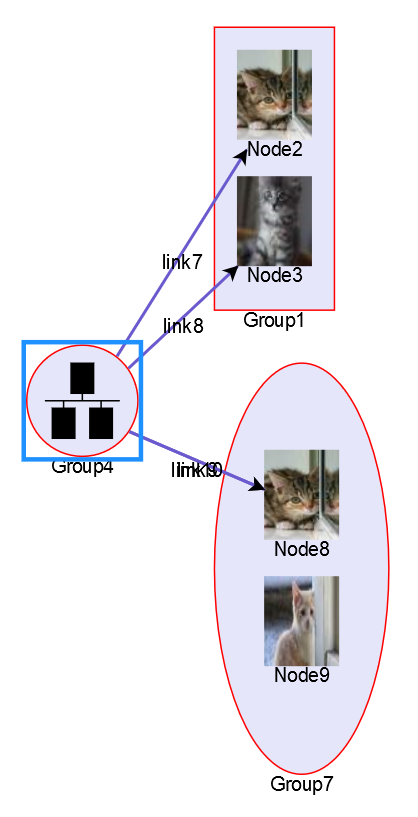
Collapse one group:
Collapse the other two groups:
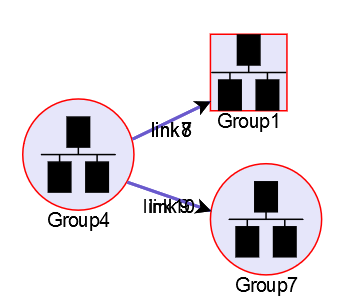
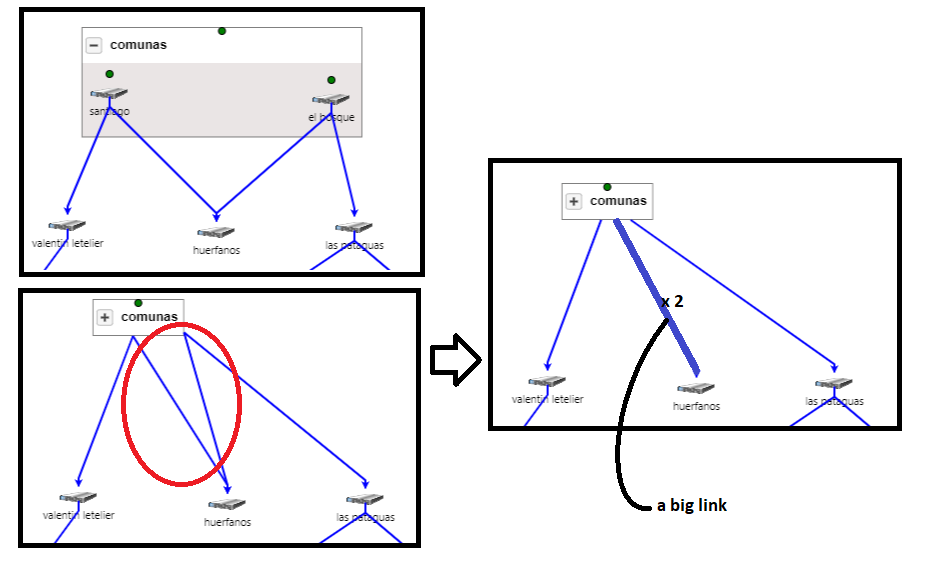
Now you can see that this code does not apply the link-bundling code that I demonstrated in my previous reply, because you can see the labels overlapping each other and the link path strokeWidth is unchanged.
So I cannot explain the routing behavior that you have circled in red in your first screenshot.