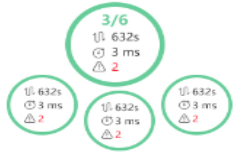
I want the group nodes to surround the nodes evenly.
Similar satellite map.
But I can’t hold down the line of the node.
I want the group nodes to surround the nodes evenly.
Similar satellite map.
But I can’t hold down the line of the node.
Could you please identify in your screenshot what the nodes are and what the group is?
Basically you may want to implement a custom Layout to be the Group.layout.
Thank you for your reply.
There are the following problems.
<!DOCTYPE html>
<html lang="en">
  <head>
    <meta charset="UTF-8" />
    <meta name="viewport" content="width=device-width, initial-scale=1.0" />
    <meta http-equiv="X-UA-Compatible" content="ie=edge" />
    <title>Document</title>
    <script src="https://unpkg.com/gojs/release/go-debug.js"></script>
  </head>
  <body>
    <div id="myDiagramDiv" style="border: solid 1px blue; height:600px"></div>
    <script>
      var radius = 55;
      var mainColor = '#66CC91';
      var $ = go.GraphObject.make;
      var data = {
        nodeDataArray: [
          {
            key: 1,
            isGroup: true,
            loc: '100 150',
            text: 'full circle',
            connectTime: '12.3h2m',
            resTime: '2s',
            mix: '1/4',
            unusual: 2,
            slices: [
              { start: -30, sweep: 60, color: 'green' },
              { start: 30, sweep: 300, color: 'red' }
            ]
          },
          {
            key: 2,
            loc: '0 350',
            text: 'partial circle',
            connectTime: '22d3h2m',
            resTime: '1s',
            mix: '4/6',
            unusual: 3,
            slices: [
              { start: 0, sweep: 30, color: 'lightgreen' },
              { start: 30, sweep: 150, color: 'lightgreen' },
              { start: 180, sweep: 70, color: 'blue' },
              { start: 250, sweep: 30, color: 'green' },
              { start: 280, sweep: 60, color: 'yellow' },
              { start: 340, sweep: 20, color: 'red' }
            ]
          },
          {
            key: 3,
            loc: '350 350',
            text: 'service: 8080',
            mix: '1/2',
            unusual: 1,
            slices: [
              { start: 0, sweep: 180, color: 'lightgreen' },
              { start: 180, sweep: 70, color: 'blue' },
              { start: 250, sweep: 30, color: 'green' },
              { start: 280, sweep: 60, color: 'yellow' },
              { start: 340, sweep: 20, color: 'red' }
            ]
          },
          {
            key: 4,
            text: 'service: 8089',
            mix: '1/0',
            group: 1
          }, {
            key: 5,
            text: 'service: 8088',
            mix: '1/2',
            group: 1
          },
          {
            key: 6,
            text: 'service: 8087',
            mix: '1/6',
            group: 1
          }
        ],

        linkDataArray: [
          { from: 1, to: 2, count: 38, time: 300 },
          { from: 1, to: 3, count: 138, name: 'PIPE', time: 1990 },
          { from: 2, to: 3, count: 168, time: 80000 }
        ]
      };

      function linkColor(num) {
        const T = 500; // ms
        if (num < T) {
          return 'green';
        } else if (num < 4 * T) {
          return 'yellow';
        } else {
          return 'red';
        }
      }
      function updateModel(val) {
        if (val instanceof go.Model) {
          myDiagram.model = val;
        } else {
          const m = new go.GraphLinksModel();
          if (val) {
            for (let p in val) {
              m[p] = val[p];
            }
          }
          myDiagram.model = m;
        }
      }

      var myDiagram = $(go.Diagram, 'myDiagramDiv', {
        'undoManager.isEnabled': true,
        'toolManager.mouseWheelBehavior': go.ToolManager.WheelZoom,

        nodeTemplate: $(
          go.Node,
          'Vertical',
          $(
            go.Panel,
            'Auto',
            $(go.Panel, new go.Binding('itemArray', 'slices'), {
              itemTemplate: $(
                go.Panel,
                $(
                  go.Shape,
                  {
                    fill: 'transparent',
                    stroke: 'cyan',
                    strokeWidth: 10,
                    isGeometryPositioned: true,
                    mouseEnter: function(node, obj) {
                      // console.log("mouseEnter", obj.part.data);
                    },
                    mouseLeave: function(node, obj) {
                      // console.log("mouseLeave:", obj.part.data);
                    }
                  },
                  new go.Binding('stroke', 'color'),
                  new go.Binding('geometry', '', function(data) {
                    var position = new go.Point(radius, 0).rotate(data.start).offset(radius, radius);
                    return new go.Geometry().add(
                      new go.PathFigure(position.x, position.y).add(
                        new go.PathSegment(go.PathSegment.Arc, data.start, data.sweep, radius, radius, radius, radius)
                      )
                    );
                  })
                )
              )
            }),
            $(
              go.Panel,
              'Table',
              {
                alignment: go.Spot.Center
              },
              $(
                go.TextBlock,
                {
                  row: 0,
                  column: 0,
                  columnSpan: 2,
                  font: 'bold 16pt helvetica, bold arial, sans-serif',
                  stroke: mainColor
                },
                new go.Binding('text', 'mix')
              )
            )
          ),
          {
            // menu
            contextMenu: $(
              'ContextMenu',
              $('ContextMenuButton', $(go.TextBlock, 'open'), {
                click: function() {
                  var cmd = myDiagram.commandHandler;
                  if (cmd.canCollapseSubGraph()) {
                    cmd.collapseSubGraph();
                  } else {
                    cmd.expandSubGraph();
                  }
                }
              })
            )
          },
          new go.Binding('location', 'loc', go.Point.parse).makeTwoWay(go.Point.stringify),
          $(go.TextBlock, new go.Binding('text'))
        ),

        linkTemplate: $(
          go.Link,
          {
            curve: go.Link.Bezier,
            adjusting: go.Link.Stretch,
            reshapable: true,
            relinkableFrom: true,
            relinkableTo: true,
            toShortLength: 5
          },
          new go.Binding('points').makeTwoWay(),
          new go.Binding('curviness'),

          $(
            go.Shape,
            {
              isPanelMain: true,
              stroke: mainColor,
              strokeWidth: 1
            },
            new go.Binding('stroke', '', function(data) {
              return linkColor(data.time);
            }),
            new go.Binding('name', 'name'),
            new go.Binding('strokeDashArray', '', function(data) {
              return data.name ? [4, 4] : '';
            })
          ),
          $(
            go.Shape,
            {
              toArrow: 'standard'
            },
            new go.Binding('fill', '', function(data) {
              return linkColor(data.time);
            }),
            new go.Binding('stroke', '', function(data) {
              return linkColor(data.time);
            })
          )
        ),

        groupTemplate: $(
          go.Group,
          'Auto',
          $(go.Panel, 'Auto', $(go.Shape, 'Circle', { fill: null, stroke: 'gray', strokeWidth: 2 }))
        ),

        model: $(go.GraphLinksModel, {
          copiesArrays: true,
          copiesArrayObjects: true
        })
      });
      updateModel(data);
    </script>
  </body>
</html>
Thanks for providing the code. We’ll try it tomorrow morning.
The first thing I notice is that the code outputs a lot of errors in the console window. If you fix them you may avoid other problems later.
Second, to keep the member Nodes of the Group within the bounds of the Group, use a Placeholder. Something like:
        groupTemplate:
          $(go.Group,'Auto',
            $(go.Panel, 'Auto', $(go.Shape, 'Circle', { fill: null, stroke: 'gray', strokeWidth: 2 }),
            $(go.Placeholder))
          ),
But you may want to use a Group.layout. You could try using PackedLayout, from the extensionsTS directory.
Regarding the context menu button’s text, just bind the TextBlock.text property with a conversion function that returns the string that you want to show.
              $('ContextMenu',
                $('ContextMenuButton',
                  $(go.TextBlock, 'open',
                    new go.Binding('text', '', function(part) {
                        return ... ? 'open' : 'close';
                      }).ofObject()),
By the way, the button’s click event handler that you wrote does not look like it is likely to work, since it depends on the Group being selected. Also, if the Group is collapsed (Group.isSubGraphExpanded is false) then the member Nodes will be invisible, in which case the user cannot perform a context click on them.
Thank you for your reply.It helps me a lot.But I don’t understand how that surround type works.
I’m stuck folding and expanding group graphics.
Have you set the Group.layout in your group template to a layout such as PackedLayout or GridLayout?
Find new problems, if there is no location, it will suppress the graph.
Regarding Node.location, if the location is (NaN, NaN), the diagram cannot draw the node, because it does not know where to draw it. However most Layouts will try to assign a real Point location to each Node that it lays out.
Are the nodes with “calls” in their text members of the group? Either you are not using a Placeholder in the Group template, or that template does not surround the placeholder with something visible so that the group appears to include those member nodes.
But none of this data uses groups. The code is in the previous code. I’m just switching data here.
If you remove this line.Will display correctly
This is your code, from the post above, modified with the Group template I suggested, and using PackedLayout as I suggested:
<!DOCTYPE html>
<html lang="en">
  <head>
    <meta charset="UTF-8" />
    <meta name="viewport" content="width=device-width, initial-scale=1.0" />
    <meta http-equiv="X-UA-Compatible" content="ie=edge" />
    <title>Document</title>
    <script src="https://unpkg.com/gojs/release/go.js"></script>
    <script src="https://unpkg.com/[email protected]/require.js"></script>
  </head>
  <body>
    <div id="myDiagramDiv" style="border: solid 1px blue; height:600px"></div>
    <script>
  require(["../extensionsTS/PackedLayout.js"], function(plmod) {
      var PackedLayout = plmod.PackedLayout;
      var radius = 55;
      var mainColor = '#66CC91';
      var $ = go.GraphObject.make;
      var data = {
        nodeDataArray: [
          {
            key: 1,
            isGroup: true,
            loc: '100 150',
            text: 'full circle',
            connectTime: '12.3h2m',
            resTime: '2s',
            mix: '1/4',
            unusual: 2,
            slices: [
              { start: -30, sweep: 60, color: 'green' },
              { start: 30, sweep: 300, color: 'red' }
            ]
          },
          {
            key: 2,
            loc: '0 350',
            text: 'partial circle',
            connectTime: '22d3h2m',
            resTime: '1s',
            mix: '4/6',
            unusual: 3,
            slices: [
              { start: 0, sweep: 30, color: 'lightgreen' },
              { start: 30, sweep: 150, color: 'lightgreen' },
              { start: 180, sweep: 70, color: 'blue' },
              { start: 250, sweep: 30, color: 'green' },
              { start: 280, sweep: 60, color: 'yellow' },
              { start: 340, sweep: 20, color: 'red' }
            ]
          },
          {
            key: 3,
            loc: '350 350',
            text: 'service: 8080',
            mix: '1/2',
            unusual: 1,
            slices: [
              { start: 0, sweep: 180, color: 'lightgreen' },
              { start: 180, sweep: 70, color: 'blue' },
              { start: 250, sweep: 30, color: 'green' },
              { start: 280, sweep: 60, color: 'yellow' },
              { start: 340, sweep: 20, color: 'red' }
            ]
          },
          {
            key: 4,
            text: 'service: 8089',
            mix: '1/0',
            group: 1
          }, {
            key: 5,
            text: 'service: 8088',
            mix: '1/2',
            group: 1
          },
          {
            key: 6,
            text: 'service: 8087',
            mix: '1/6',
            group: 1
          }
        ],

        linkDataArray: [
          { from: 1, to: 2, count: 38, time: 300 },
          { from: 1, to: 3, count: 138, name: 'PIPE', time: 1990 },
          { from: 2, to: 3, count: 168, time: 80000 }
        ]
      };

      function linkColor(num) {
        const T = 500; // ms
        if (num < T) {
          return 'green';
        } else if (num < 4 * T) {
          return 'yellow';
        } else {
          return 'red';
        }
      }
      function updateModel(val) {
        if (val instanceof go.Model) {
          myDiagram.model = val;
        } else {
          const m = new go.GraphLinksModel();
          if (val) {
            for (let p in val) {
              m[p] = val[p];
            }
          }
          myDiagram.model = m;
        }
      }

      var myDiagram = $(go.Diagram, 'myDiagramDiv', {
        'undoManager.isEnabled': true,
        'toolManager.mouseWheelBehavior': go.ToolManager.WheelZoom,

        nodeTemplate: $(
          go.Node,
          'Vertical',
          $(
            go.Panel,
            'Auto',
            $(go.Panel, new go.Binding('itemArray', 'slices'), {
              itemTemplate: $(
                go.Panel,
                $(
                  go.Shape,
                  {
                    fill: 'transparent',
                    stroke: 'cyan',
                    strokeWidth: 10,
                    isGeometryPositioned: true,
                    mouseEnter: function(node, obj) {
                      // console.log("mouseEnter", obj.part.data);
                    },
                    mouseLeave: function(node, obj) {
                      // console.log("mouseLeave:", obj.part.data);
                    }
                  },
                  new go.Binding('stroke', 'color'),
                  new go.Binding('geometry', '', function(data) {
                    var position = new go.Point(radius, 0).rotate(data.start).offset(radius, radius);
                    return new go.Geometry().add(
                      new go.PathFigure(position.x, position.y).add(
                        new go.PathSegment(go.PathSegment.Arc, data.start, data.sweep, radius, radius, radius, radius)
                      )
                    );
                  })
                )
              )
            }),
            $(
              go.Panel,
              'Table',
              {
                alignment: go.Spot.Center
              },
              $(
                go.TextBlock,
                {
                  row: 0,
                  column: 0,
                  columnSpan: 2,
                  font: 'bold 16pt helvetica, bold arial, sans-serif',
                  stroke: mainColor
                },
                new go.Binding('text', 'mix')
              )
            )
          ),
          {
            // menu
            contextMenu: $(
              'ContextMenu',
              $('ContextMenuButton', $(go.TextBlock, 'open'), {
                click: function() {
                  var cmd = myDiagram.commandHandler;
                  if (cmd.canCollapseSubGraph()) {
                    cmd.collapseSubGraph();
                  } else {
                    cmd.expandSubGraph();
                  }
                }
              })
            )
          },
          new go.Binding('location', 'loc', go.Point.parse).makeTwoWay(go.Point.stringify),
          $(go.TextBlock, new go.Binding('text'))
        ),

        linkTemplate: $(
          go.Link,
          {
            curve: go.Link.Bezier,
            adjusting: go.Link.Stretch,
            reshapable: true,
            relinkableFrom: true,
            relinkableTo: true,
            toShortLength: 5
          },
          new go.Binding('points').makeTwoWay(),
          new go.Binding('curviness'),

          $(
            go.Shape,
            {
              isPanelMain: true,
              stroke: mainColor,
              strokeWidth: 1
            },
            new go.Binding('stroke', '', function(data) {
              return linkColor(data.time);
            }),
            new go.Binding('name', 'name'),
            new go.Binding('strokeDashArray', '', function(data) {
              return data.name ? [4, 4] : '';
            })
          ),
          $(
            go.Shape,
            {
              toArrow: 'standard'
            },
            new go.Binding('fill', '', function(data) {
              return linkColor(data.time);
            }),
            new go.Binding('stroke', '', function(data) {
              return linkColor(data.time);
            })
          )
        ),

        groupTemplate:
          $(go.Group,'Auto',
            { layout: $(PackedLayout) },
            $(go.Panel, 'Auto', $(go.Shape, 'Circle', { fill: null, stroke: 'gray', strokeWidth: 2 }),
            $(go.Placeholder))
          ),

        model: $(go.GraphLinksModel, {
          copiesArrays: true,
          copiesArrayObjects: true
        })
      });
      updateModel(data);
  });
    </script>
  </body>
</html>
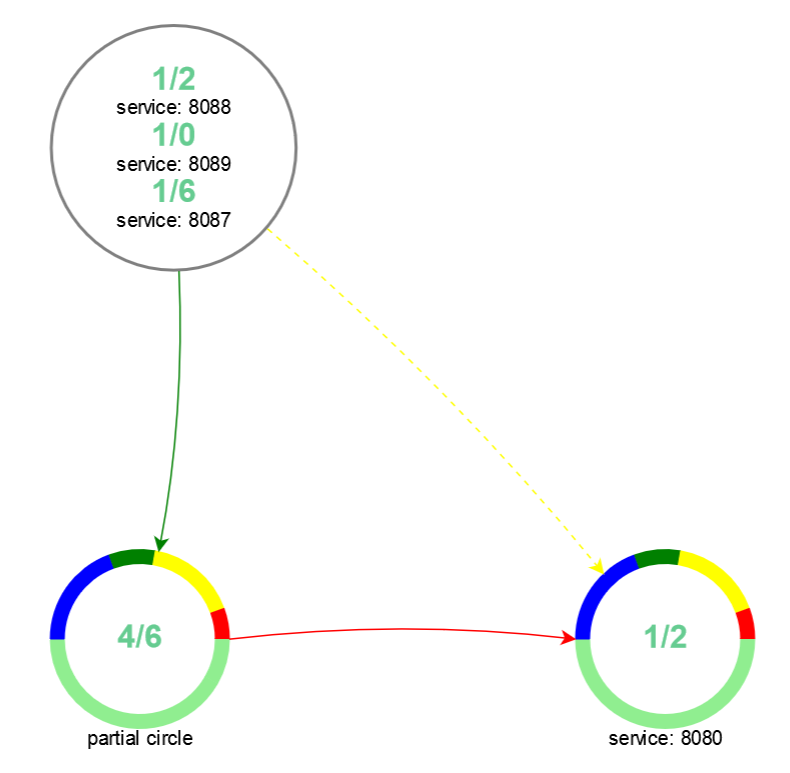
Thank you for your many replies.
I used the GridLayout you recommended.
I’ll work it out here.
updateDiagramFromData();
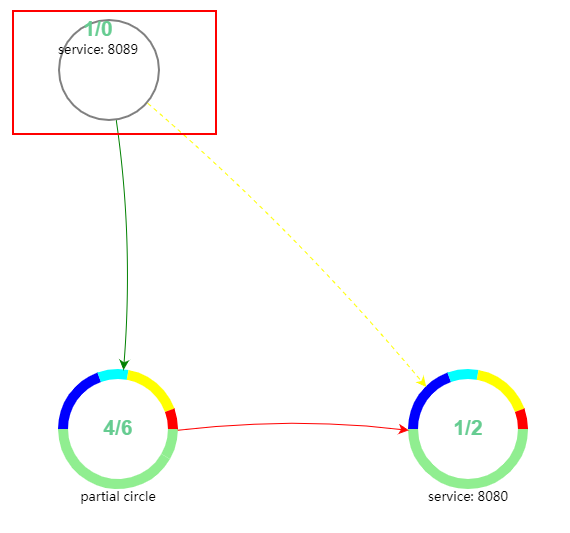
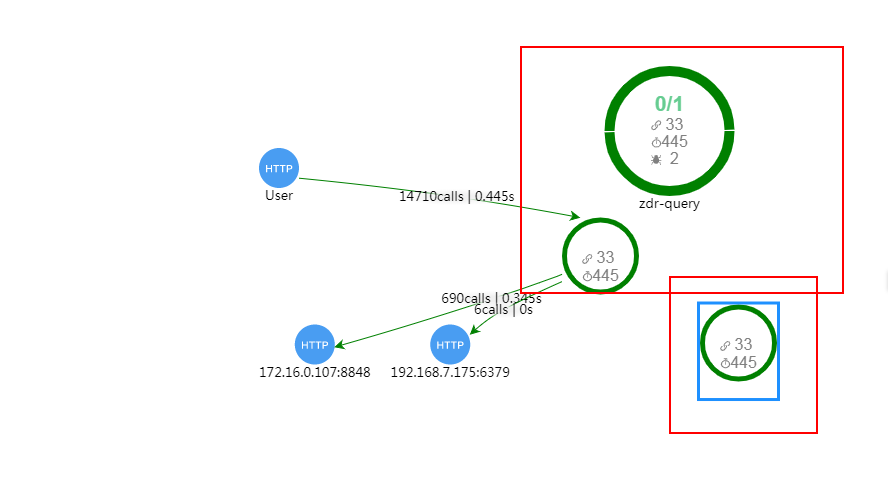
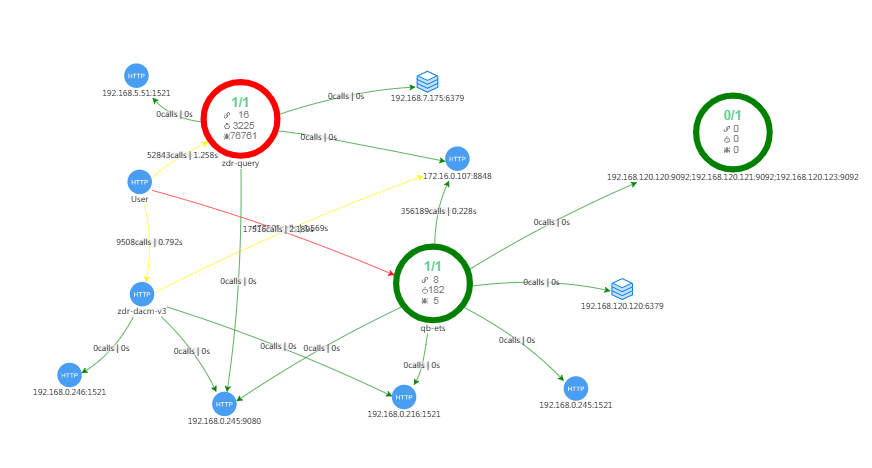
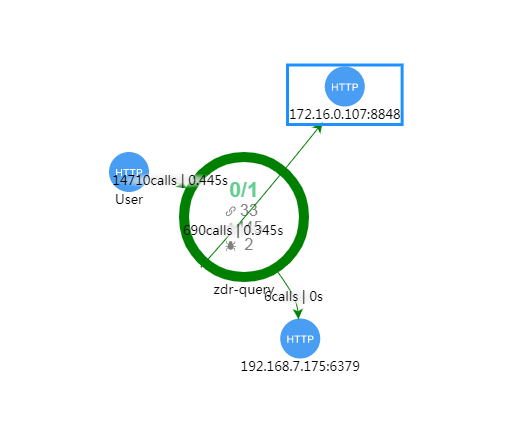
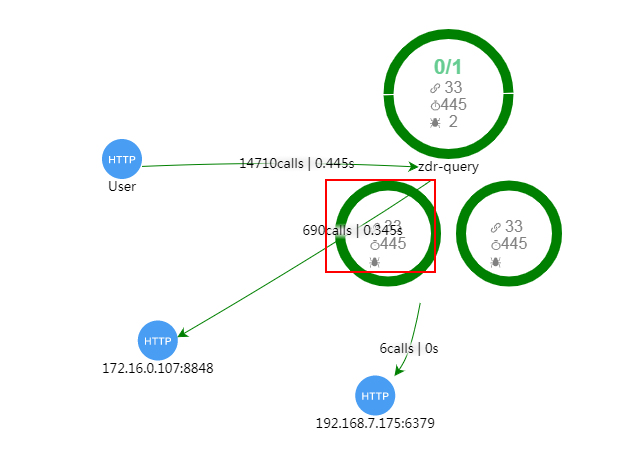
I want the line to point to the figure in my red box.
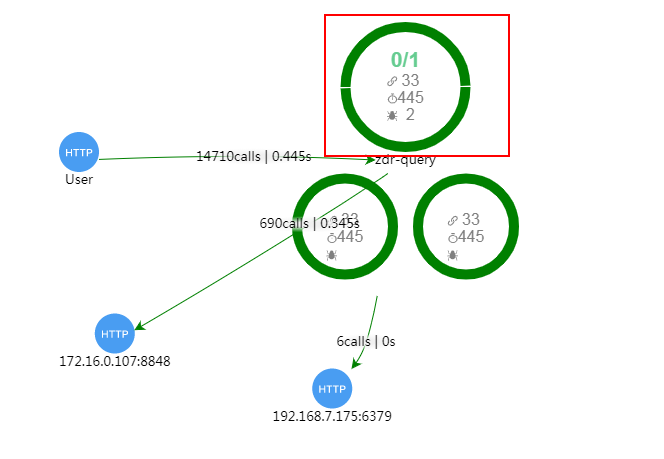
I want to drag the whole rather than the individual.
Because without location, it looks compact.
code
groupTemplate: $(
go.Group,
go.Panel.Auto,
{
isSubGraphExpanded: false
},
$(
go.Panel,
"Vertical",
$(
go.Panel,
"Auto",
{
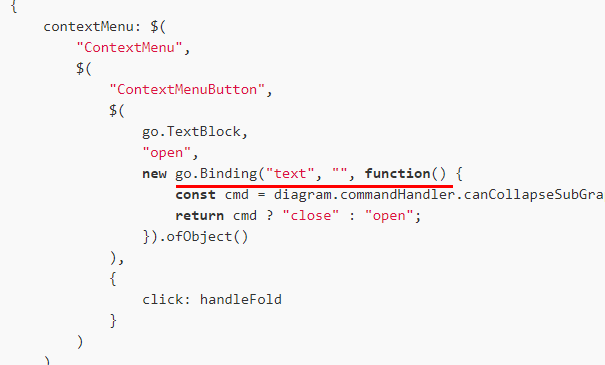
contextMenu: $(
"ContextMenu",
$(
"ContextMenuButton",
$(
go.TextBlock,
"open",
new go.Binding("text", "", function() {
const cmd = diagram.commandHandler.canCollapseSubGraph();
return cmd ? "close" : "open";
}).ofObject()
),
{
click: handleFold
}
)
)
},
$(
go.Panel,
"Auto",
$(go.Panel, new go.Binding("itemArray", "slices"), {
itemTemplate: $(
go.Panel,
$(
go.Shape,
{
fill: "transparent",
stroke: "cyan",
strokeWidth: 10,
isGeometryPositioned: true,
mouseEnter: function(node, obj) {
// console.log("mouseEnter", obj.part.data);
},
mouseLeave: function(node, obj) {
// console.log("mouseLeave:", obj.part.data);
}
},
new go.Binding("stroke", "color"),
new go.Binding("geometry", "", makeGeo)
)
)
}),
$(
go.Panel,
"Table",
{
alignment: go.Spot.Center
},
$(
go.TextBlock,
{
row: 0,
column: 0,
columnSpan: 2,
font: "bold 16pt helvetica, bold arial, sans-serif",
stroke: primaryColor
},
new go.Binding(
"text",
({ activeNum, instanceNum }) => `${activeNum}/${instanceNum}`
)
),
$(go.Shape, {
row: 1,
column: 0,
fill: "gray",
strokeWidth: 0,
width: 10,
height: 10,
geometry: geoFunc("link")
}),
$(
go.TextBlock,
{
row: 1,
column: 1,
font: "12pt helvetica, bold arial, sans-serif",
stroke: "gray"
},
new go.Binding("text", "respCount")
),
$(go.Shape, {
row: 2,
column: 0,
fill: "gray",
strokeWidth: 0,
width: 10,
height: 10,
geometry: geoFunc("time")
}),
$(
go.TextBlock,
{
row: 2,
column: 1,
font: "12pt helvetica, bold arial, sans-serif",
stroke: "gray"
},
new go.Binding("text", "respTime")
),
$(go.Shape, {
row: 3,
column: 0,
fill: "gray",
strokeWidth: 0,
width: 10,
height: 10,
geometry: geoFunc("bug")
}),
$(
go.TextBlock,
{
row: 3,
column: 1,
font: "12pt helvetica, bold arial, sans-serif",
stroke: "gray"
},
new go.Binding("text", "errorNum")
)
)
)
),
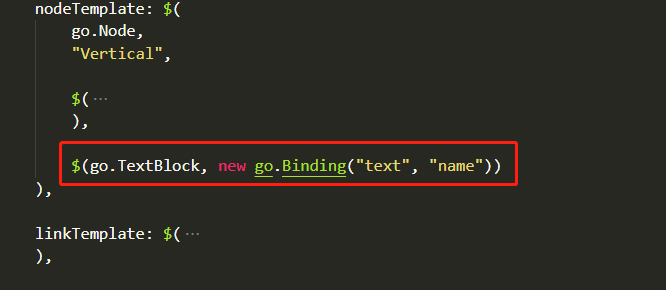
$(go.TextBlock, new go.Binding("text", "name")),
$(go.Placeholder, { margin: 5 })
),
{
layout: $(go.GridLayout, { cellSize: new go.Size(1, 1), alignment: go.GridLayout.Position })
}
),
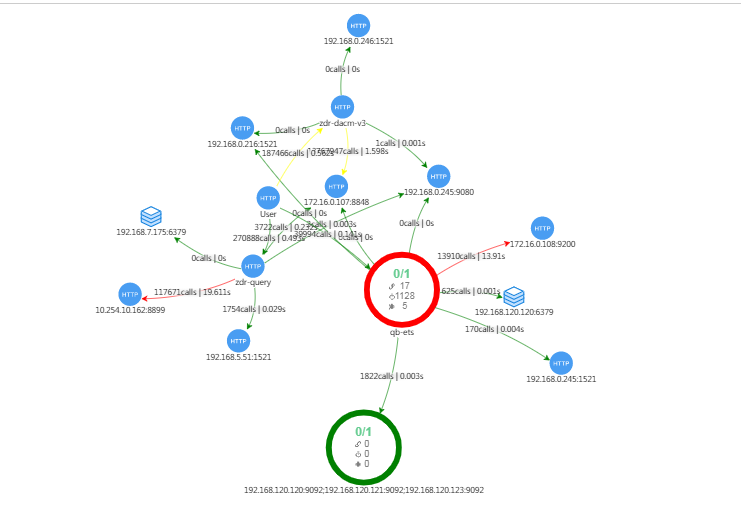
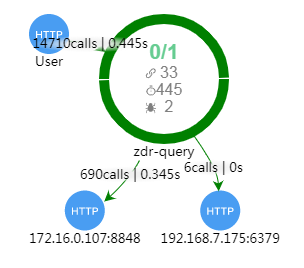
What is the model? What nodes do those green links connect?
Simple picture
const EntityTemplate = $(
            go.Node,
            "Auto",
            $(
                go.Panel,
                "Vertical",
                $(
                    go.Picture,
                    {
                        width: 40,
                        height: 40
                    },
                    new go.Binding("source", "img")
                ),
                $(go.TextBlock, new go.Binding("text", "name"))
            )
        )
What is the JSON model? Which nodes do those green links connect?
Try using ForceDirectedLayout instead.
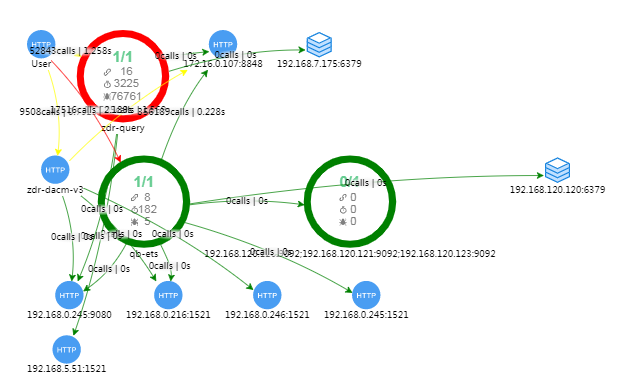
It’s better than before. But there’s still overlap.
I think the text on the line is blocked. It looks very messy.
I suppose you could try increasing the ForceDirectedLayout.defaultSpringLength. Or fiddle with its other properties.
However, as a human looking at your graph, it is not clear to me how I could improve it by moving nodes around. So maybe that is just a difficult case. We cannot guarantee that the layout will produce an optimal result as judged by humans, or even a nice or pretty result.
Is there a demo for this