Here’s the first part of what you want:
<!DOCTYPE html>
<html>
<head>
<title>Minimal GoJS Sample</title>
<!-- Copyright 1998-2022 by Northwoods Software Corporation. -->
</head>
<body>
<div id="myDiagramDiv" style="border: solid 1px black; width:100%; height:400px"></div>
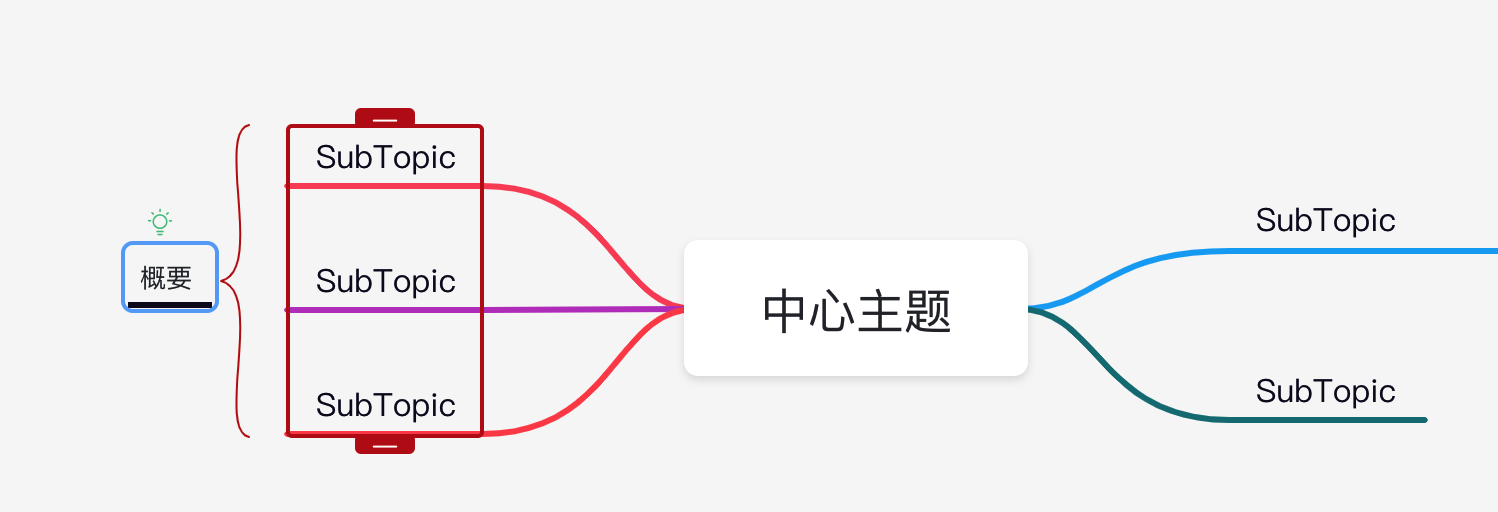
Select the "Alpha" Node and then click this button:
<button id="myTestButton">make Group for selected ungrouped Nodes</button>
<textarea id="mySavedModel" style="width:100%;height:250px"></textarea>
<script src="go.js"></script>
<script id="code">
const $ = go.GraphObject.make;
const myDiagram =
$(go.Diagram, "myDiagramDiv",
{
layout: $(go.TreeLayout, { layerSpacing: 50, isRealtime: false }),
"undoManager.isEnabled": true,
"ModelChanged": e => { // just for demonstration purposes,
if (e.isTransactionFinished) { // show the model data in the page's TextArea
document.getElementById("mySavedModel").textContent = e.model.toJson();
}
}
});
myDiagram.nodeTemplate =
$(go.Node, "Auto",
$(go.Shape,
{ fill: "white", portId: "", fromLinkable: true, toLinkable: true, cursor: "pointer" },
new go.Binding("fill", "color")),
$(go.TextBlock,
{ margin: 8, editable: true },
new go.Binding("text").makeTwoWay())
);
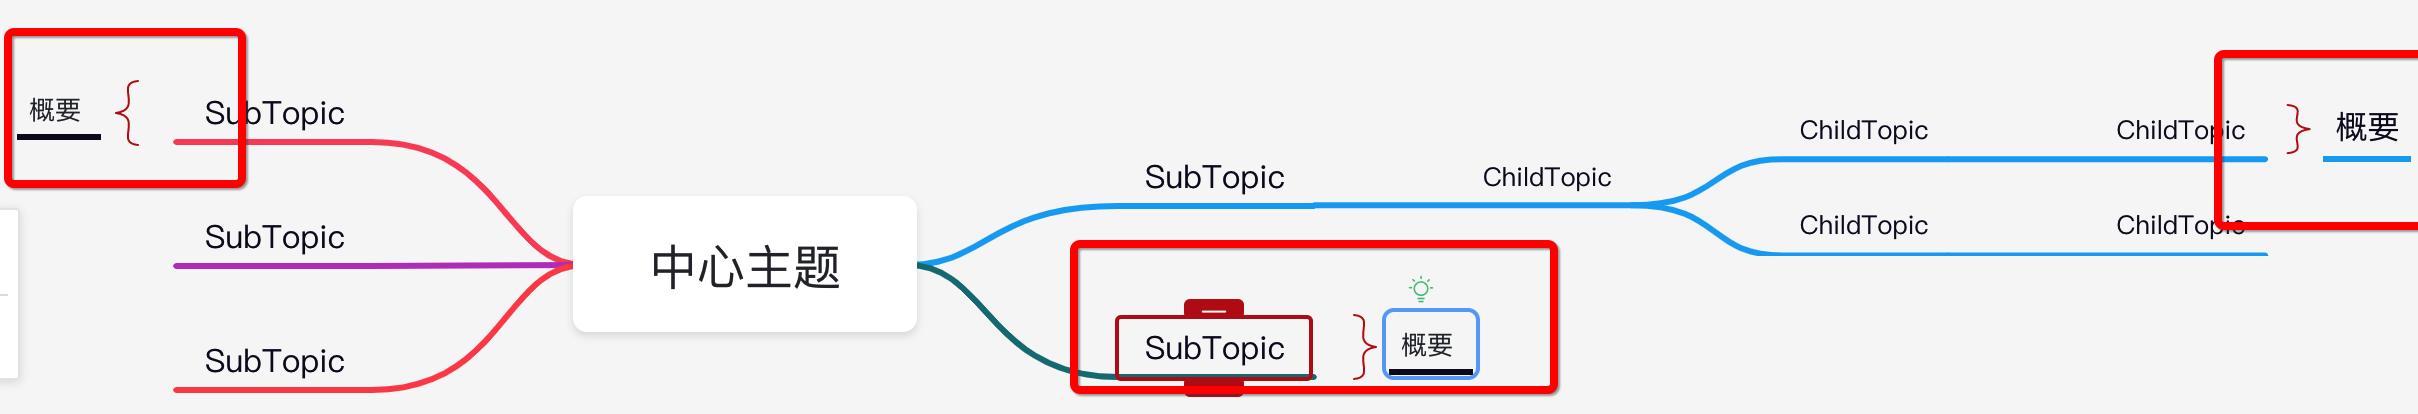
myDiagram.groupTemplate =
$(go.Group, "Spot",
{
selectionObjectName: "DETAILS",
selectionAdornmentTemplate:
$(go.Adornment, "Auto",
$(go.Shape, "RoundedRectangle", { fill: null, stroke: "dodgerblue", strokeWidth: 2 }),
$(go.Placeholder, { margin: 4 })
),
layout: null // so that the Diagram.layout ignores groups
},
$(go.Placeholder, { name: "PH" }),
$(go.Shape,
{
alignment: go.Spot.Left, alignmentFocus: new go.Spot(1, 0.5, 4, 0),
stretch: go.GraphObject.Vertical,
geometryString: "M20 0 C0 0 20 10 0 10 20 10 0 20 20 20",
stroke: "brown", strokeWidth: 1.5
},
new go.Binding("alignment", "right", r => r ? go.Spot.Right : go.Spot.Left),
new go.Binding("alignmentFocus", "right", r => r ? new go.Spot(0, 0.5, -4, 0) : new go.Spot(1, 0.5, 4, 0)),
new go.Binding("geometryString", "right", r => r ? "M0 0 C20 0 0 10 20 10 0 10 20 20 0 20" : "M20 0 C0 0 20 10 0 10 20 10 0 20 20 20")
),
$(go.Panel, "Vertical",
{
name: "DETAILS",
alignment: go.Spot.Left, alignmentFocus: new go.Spot(1, 0.5, 36, 0),
},
new go.Binding("alignment", "right", r => r ? go.Spot.Right : go.Spot.Left),
new go.Binding("alignmentFocus", "right", r => r ? new go.Spot(0, 0.5, -36, 0) : new go.Spot(1, 0.5, 36, 0)),
$(go.TextBlock,
new go.Binding("text")),
$(go.Shape, { stretch: go.GraphObject.Horizontal, height: 2, strokeWidth: 0 })
)
);
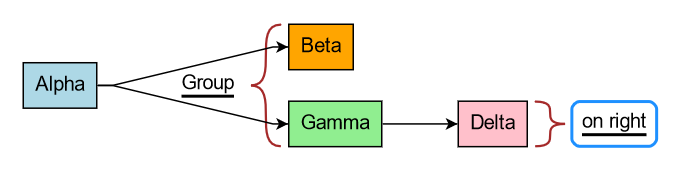
myDiagram.model = new go.GraphLinksModel(
[
{ key: 1, text: "Alpha", color: "lightblue" },
{ key: 2, text: "Beta", color: "orange" },
{ key: 3, text: "Gamma", color: "lightgreen" },
{ key: 4, text: "Delta", color: "pink", group: 5 },
{ key: 5, isGroup: true, right: true, text: "on right" },
],
[
{ from: 1, to: 2 },
{ from: 1, to: 3 },
{ from: 3, to: 4 },
]);
document.getElementById("myTestButton").addEventListener("click", e => {
if (myDiagram.selection.any(p => p instanceof go.Node && p.isTopLevel && !(p instanceof go.Group))) {
myDiagram.model.commit(m => {
const newgrp = { isGroup: true, text: "Group" };
// add the new group to the model
m.addNodeData(newgrp);
// add nodes as members of the new group
myDiagram.selection.each(p => {
if (p instanceof go.Node && p.isTopLevel && !(p instanceof go.Group)) {
m.setGroupKeyForNodeData(p.data, m.getKeyForNodeData(newgrp));
}
});
});
}
});
</script>
</body>
</html>
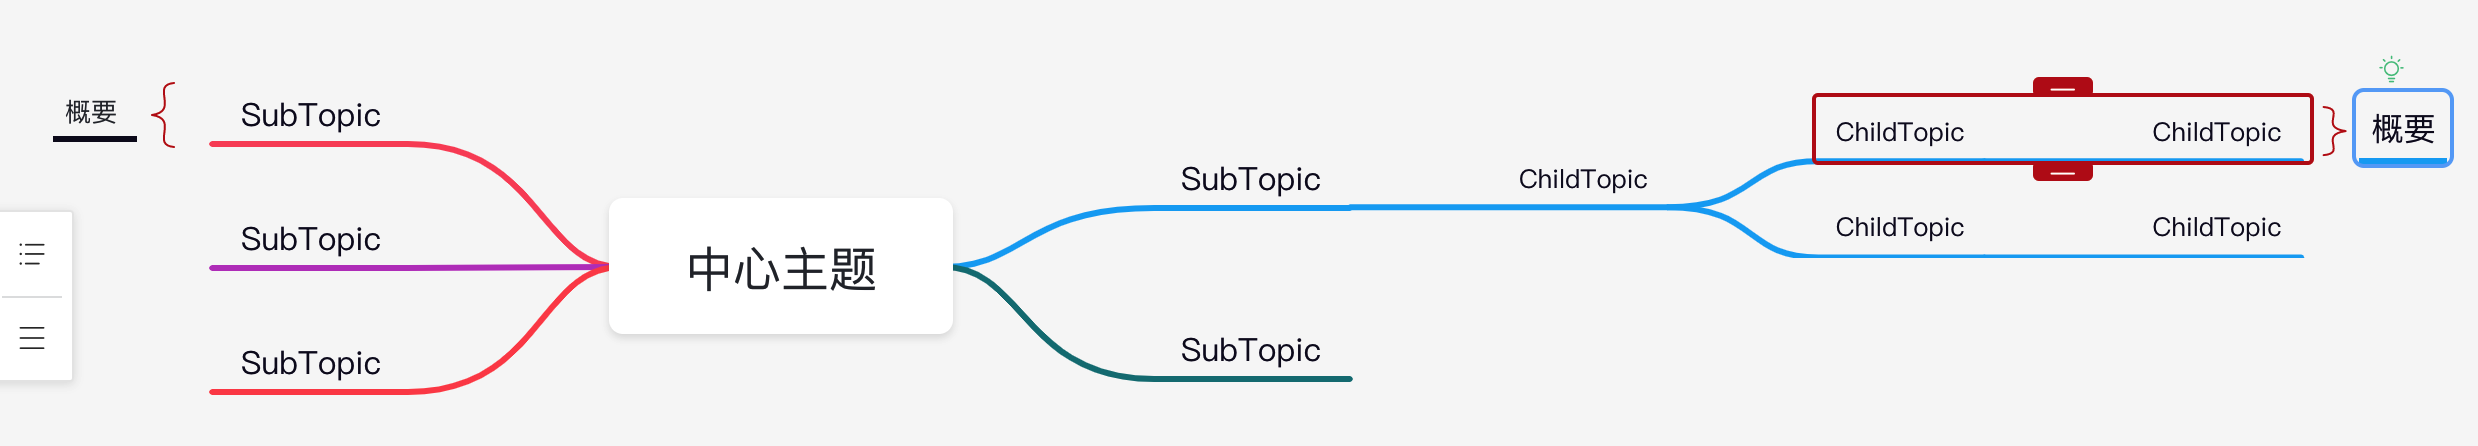
After selecting the “Beta” and “Gamma” nodes and clicking the button:
Sorry, I don’t have time now to do more. Basically, you’ll want a custom Part.resizeAdornmentTemplate on the group which also sets Part.resizeObjectName to “PH”. Then you’ll need to customize the ResizingTool so that ResizingTool.resize instead of actually changing the GraphObject.desiredSize changes the group membership of the group based on which nodes are within the resize bounds. Or something like that…