Good Morning,
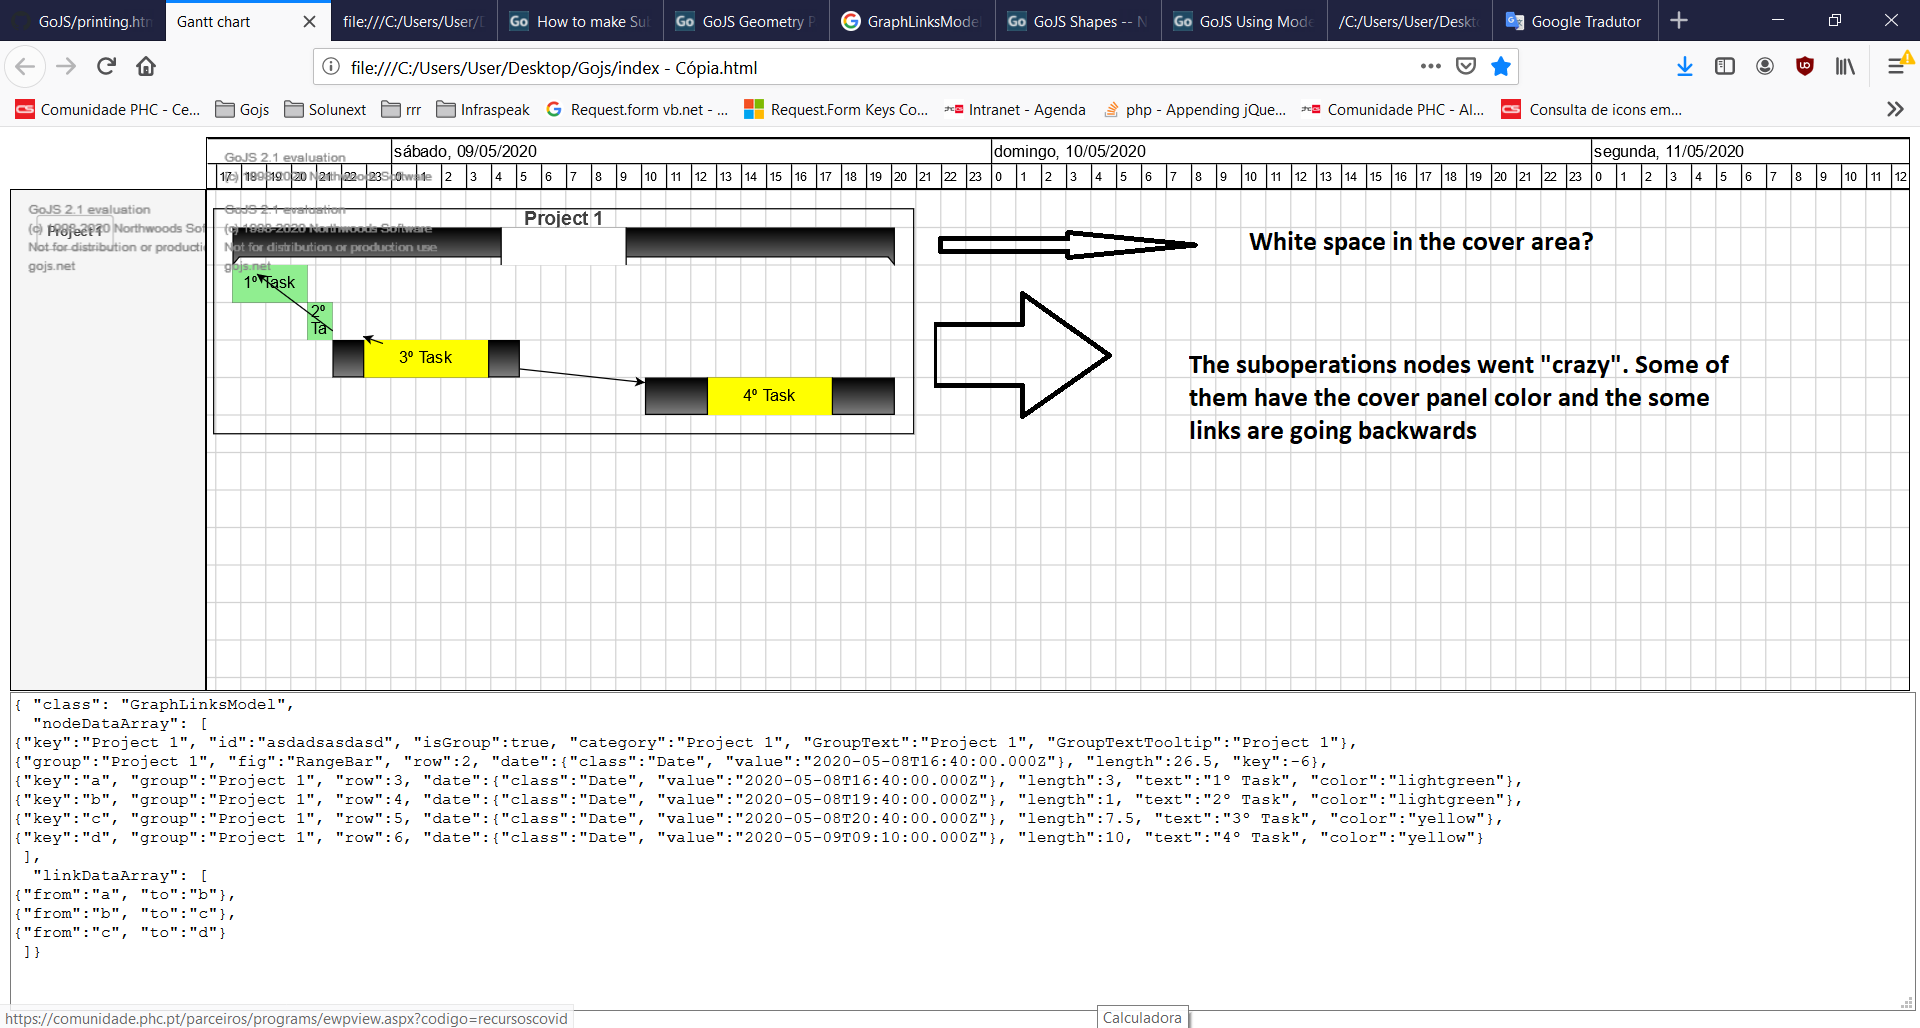
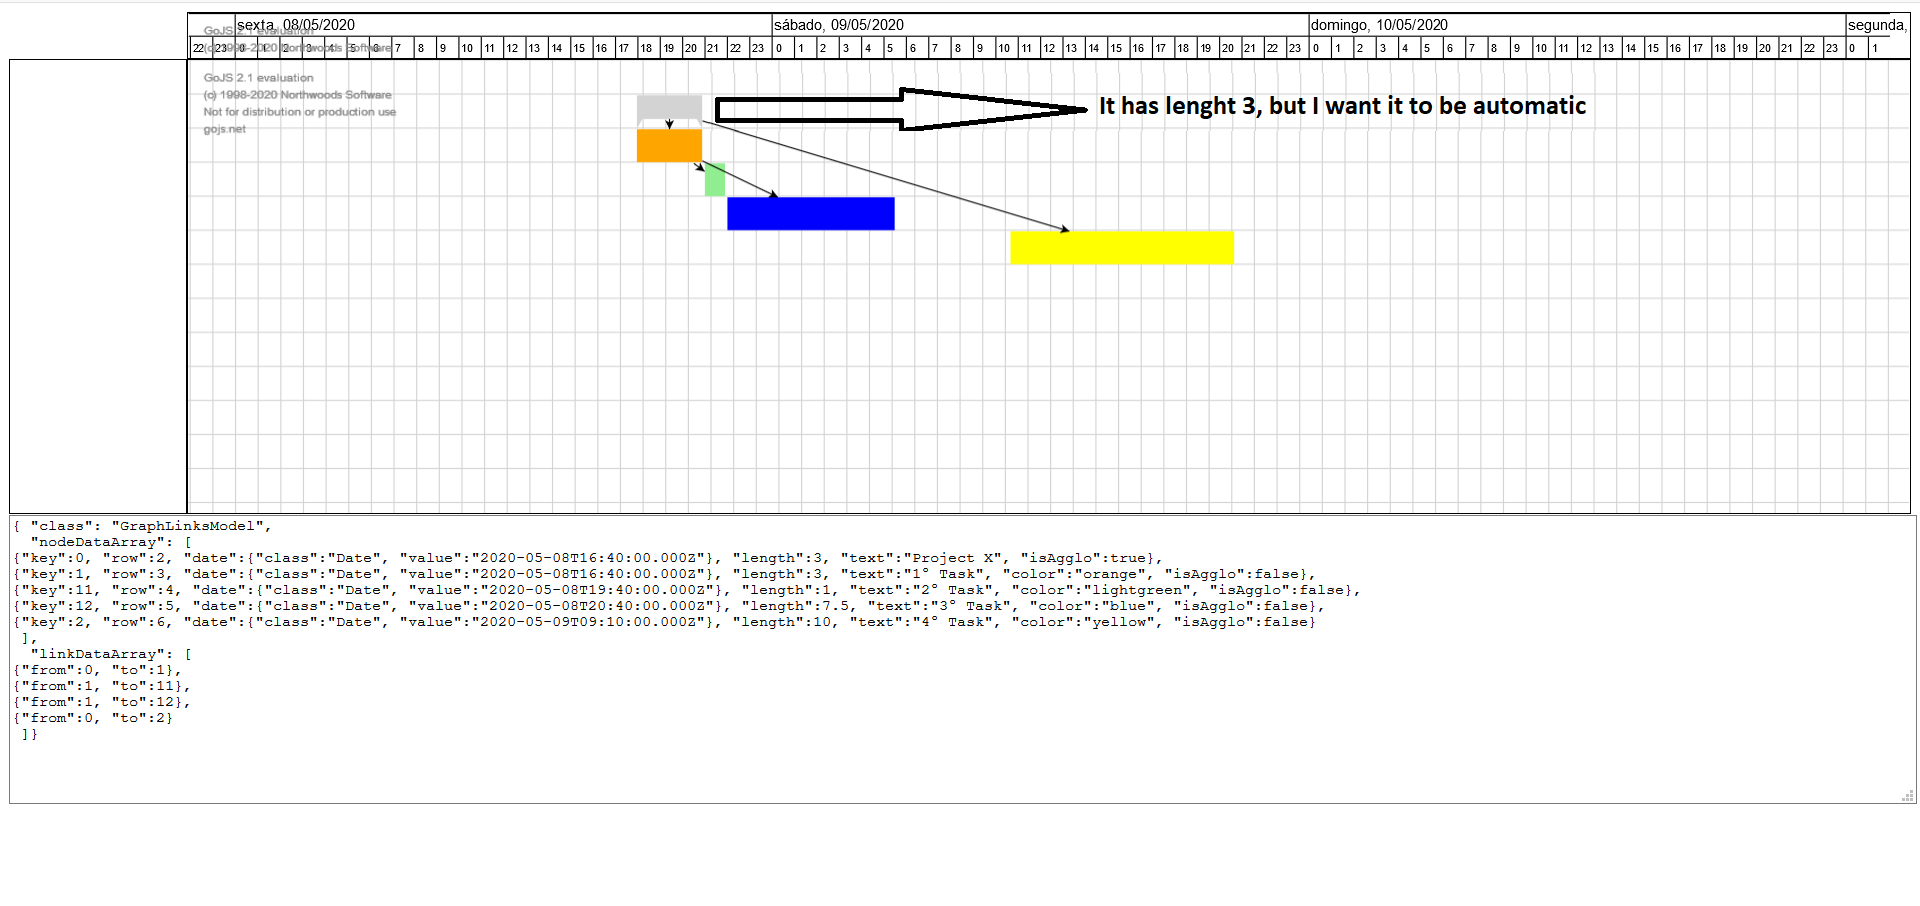
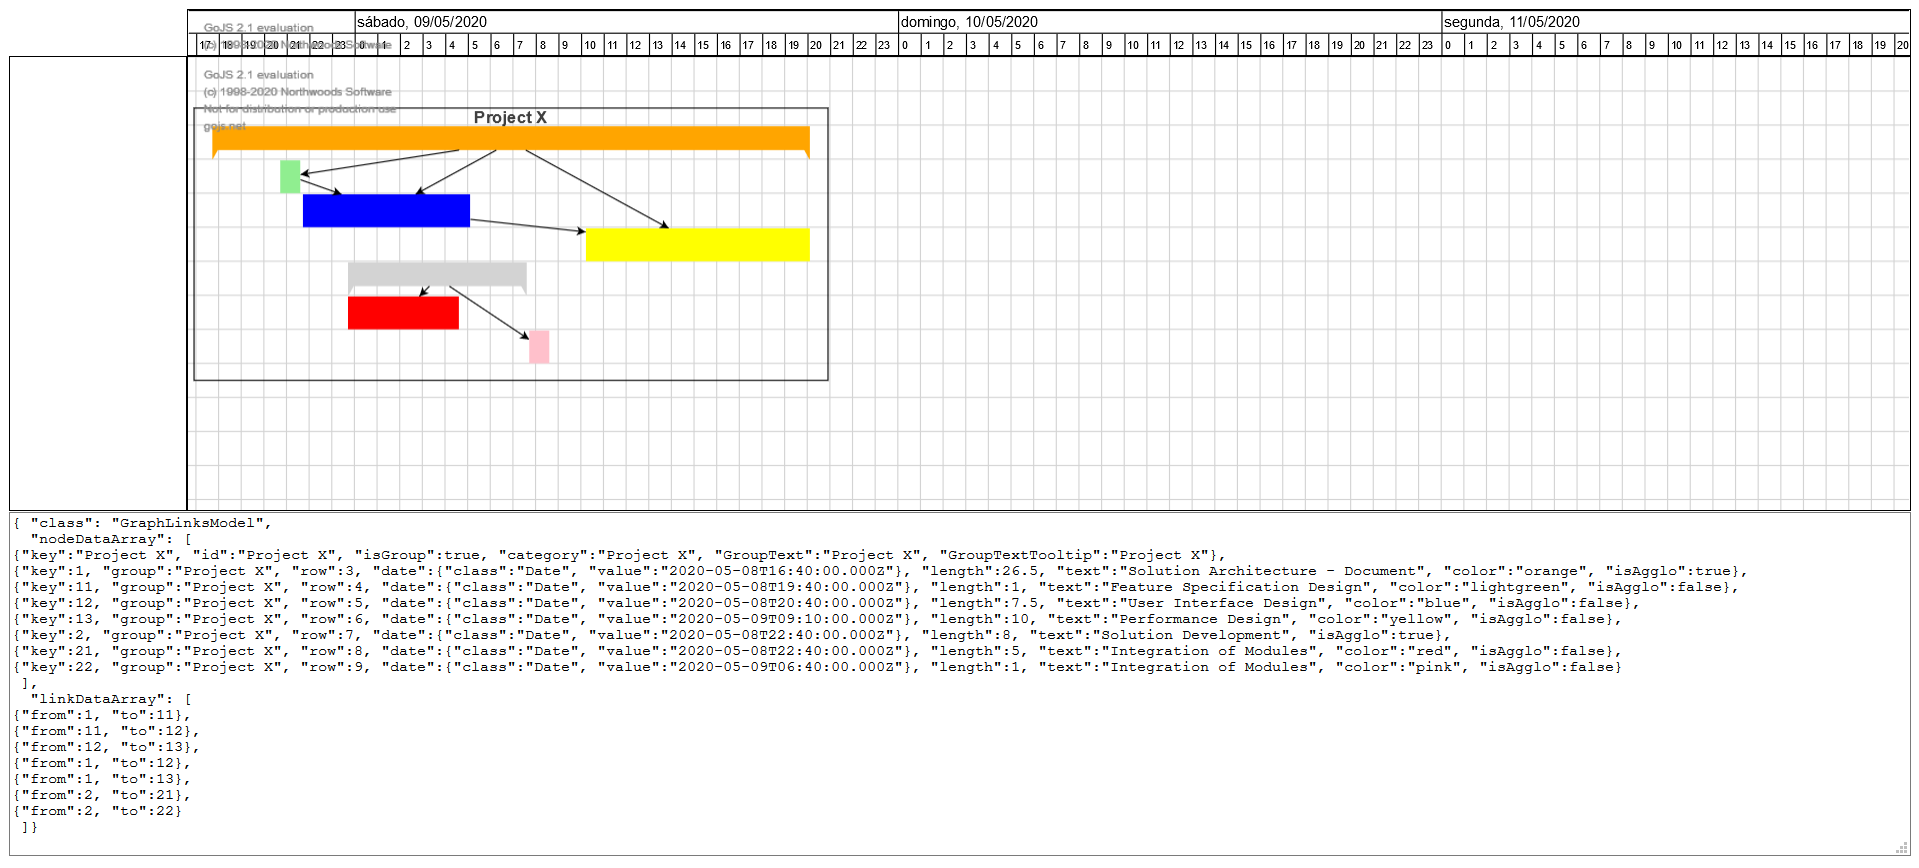
I’m creating a Gantt Diagram, and my current objective is to create a panel that covers each sub-operation. In other words, my “Project” will consist in many Operations(each has it sub-operations).
Watching the imagem below my sub-operations is the “Task”, and the Main Operation is the panel that I’m trying to create.
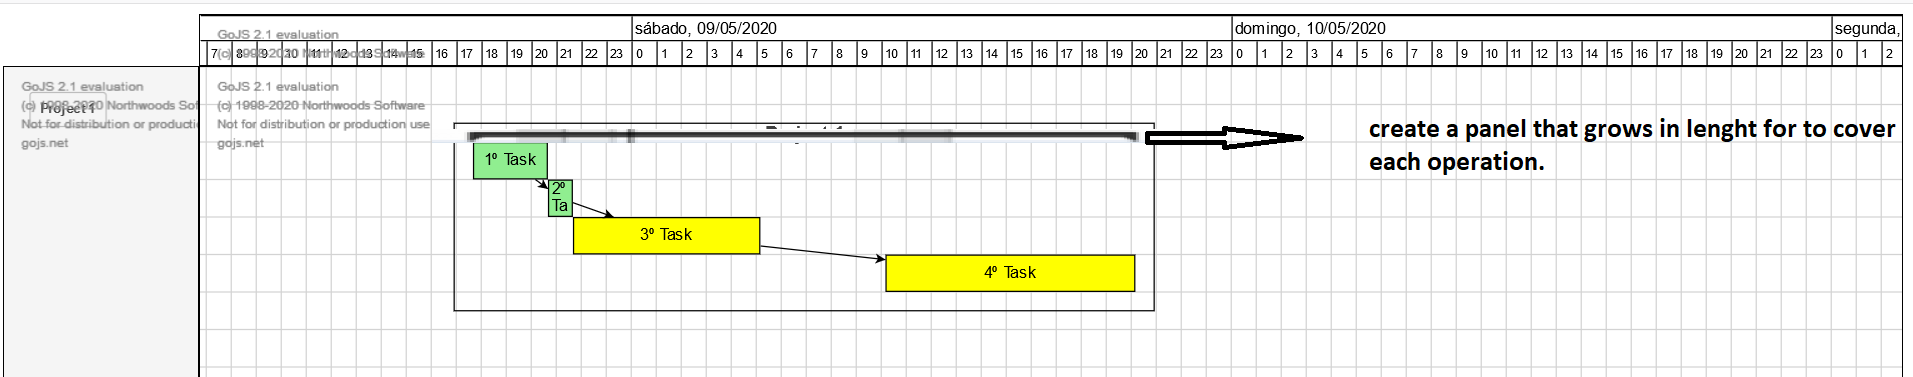
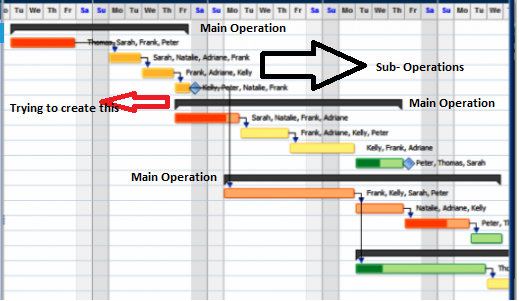
Is there any way to achieve this effect? Or any example that already exists?
Current code:
<!DOCTYPE html>
<html>
<head>
  <meta charset="UTF-8">
  <title>Gantt chart</title>
  <meta name="description" content="A Gantt chart that supports zooming into the timeline." />
  <meta name="viewport" content="width=device-width, initial-scale=1">
  <!-- Copyright 1998-2020 by Northwoods Software Corporation. -->

  <script src="go.js"></script>

 <script id="code">
  // Define Graduated Panels to show the days, to show the hours, and to separate the days and hours.

  // Assume x == 0 is OriginDate, local midnight of some date.
  var OriginDate = new Date(2020,4,8,0,0); // new Date Month starts at 0(January) and end in 11(December)

  // Assume 20 document units equals one hour.
  var HourLength = 20;
  var HoursPerDay = 24;
  var DayLength = HourLength * HoursPerDay;
  var MillisPerHour = 60 * 60 * 1000;
  var MillisPerPixel = MillisPerHour / HourLength;

  function init() {
var $ = go.GraphObject.make;

myDiagram =
  $(go.Diagram, "myDiagramDiv",  // create a Diagram for the DIV HTML element
    {
      isReadOnly: true,       // deny the user permission to alter the diagram or zoom in or out
      "animationManager.isEnabled": false,
      initialContentAlignment: go.Spot.TopLeft,
      grid:
        $(go.Panel, "Grid",
          { gridCellSize: new go.Size(HourLength, 30) },
          $(go.Shape, "LineH", { stroke: 'lightgray' }),
          $(go.Shape, "LineV", { stroke: 'lightgray' }),
        ),
      "draggingTool.isGridSnapEnabled": true,
      "resizingTool.isGridSnapEnabled": true,
      scrollMode: go.Diagram.InfiniteScroll,  // allow the diagram to be scrolled arbitrarily beyond content
      positionComputation: function(diag, pos) {  // but not too far vertically, or at all if fits in viewport
        var y = pos.y;
        if (diag.documentBounds.height < diag.viewportBounds.height) {
          y = 0;
        } else {
          y = Math.min(y, diag.documentBounds.bottom - diag.viewportBounds.height);
          if (y < 0) y = 0;  // don't show negative Y coordinates
        }
        return new go.Point(pos.x, y);
      },
      nodeTemplate:
        $(go.Node, "Auto",
          {
            height: 30,
            dragComputation: function(part, pt, gridpt) {
              return new go.Point(gridpt.x, Math.max(0, gridpt.y));
            },
            resizable: true,
            resizeAdornmentTemplate:
              $(go.Adornment, "Spot",
                $(go.Placeholder)//, //Comentado permite com que ele faça resize às "caixas"
                //$(go.Shape,  // only a right-side resize handle
                //  { alignment: go.Spot.Right, cursor: "col-resize", desiredSize: new go.Size(8, 8), fill: "dodgerblue" })
              ),
            toolTip:
              $("ToolTip",
                $(go.TextBlock,
                  new go.Binding("text", "", function(data) { return data.text + "\nstart: " + data.date + "\nhours: " + data.length; }))
              )
          },
          new go.Binding("position", "", function(data) { return new go.Point(convertDateToX(data.date), convertRowToY(data.row)); })
            .makeTwoWay(function(pos, data) { data.row = convertYToRow(pos.y); data.date = convertDateToX(pos.x); }),
          new go.Binding("width", "length", function(l) { return l * HourLength; })
            .makeTwoWay(function(w) { return w / HourLength; }),
          $(go.Shape, { fill: "white" },
            new go.Binding("fill", "color")),
          $(go.TextBlock, { editable: false }, //editable = true, permite com que ele alterar o texto
            new go.Binding("text").makeTwoWay())
        ),
      "ModelChanged": function(e) {  // just for debugging
        if (e.isTransactionFinished) {
          document.getElementById("mySavedModel").value = e.model.toJson();
        }
      },
      "undoManager.isEnabled": false // Se for igual a true, faz as funcionalidades do CTRL-Z
    });

myColumnHeaders =
  $(go.Diagram, "myColumnHeadersDiv",
    {
      isReadOnly: true,
      "animationManager.isEnabled": false,
      initialContentAlignment: go.Spot.TopLeft,
      allowHorizontalScroll: false,
      allowVerticalScroll: false,
      allowZoom: false,
      padding: 0
    });


// Basic coordinate conversions, between Dates and X values, and between rows and Y values:

function convertXToDate(x) { return new Date(OriginDate.valueOf() + x * MillisPerPixel); }

function convertDateToX(dt) { return (dt.valueOf() - OriginDate.valueOf()) / MillisPerPixel; }

function convertYToRow(y) { return Math.floor(y/30) + 1; }  // assume one-based row indexes

function convertRowToY(i) { i = Math.max(i, 1); return (i-1) * 30; }


function initColumnHeaders() {
  // Assume the Graduated Panels showing the days and hours are fixed in the document;
  // and by disallowing scrolling or zooming they will stay in the viewport.

  var gradScaleHoriz1 =
    $(go.Part, "Graduated",  // show days
      { layerName: "Grid", position: new go.Point(0, 0), graduatedTickUnit: HourLength },
      $(go.Shape, { geometryString: "M0 0 H3600" }),
      $(go.Shape, { geometryString: "M0 0 V20", interval: HoursPerDay }),  // once per day
      $(go.TextBlock,
        {
          font: "10pt sans-serif", interval: HoursPerDay,
          alignmentFocus: new go.Spot(0, 0, -2, -4),
          graduatedFunction: function(v) {
            var d = new Date(OriginDate);
            d.setDate(d.getDate() + v / DayLength);
            // format date output to string
            var options = { weekday: "short", month: "short", day: "2-digit", year: "numeric" };
            return d.toLocaleDateString("pt-PT", options);
          }
        })
    );

  var gradScaleHoriz2 =
    $(go.Part, "Graduated",  // show hour of day
      { layerName: "Grid", position: new go.Point(0, 20), graduatedTickUnit: HourLength },
      $(go.Shape, { geometryString: "M0 30 H3600" }),
      $(go.Shape, { geometryString: "M0 0 V20" }),  // every hour
      $(go.TextBlock,
        {
          font: "7pt sans-serif",
          segmentOffset: new go.Point(7, 7),
          graduatedFunction: function(v) {
            v = (v / HourLength) % HoursPerDay;  // convert document coordinates to hour of day
            if (v < 0) v += HoursPerDay;
            return Math.floor(v).toString();
          }
        }
      )
    );

  // Add each part to the diagram
  myColumnHeaders.add(gradScaleHoriz1);
  myColumnHeaders.add(gradScaleHoriz2);

  // Add listeners to keep the scales/indicators in sync with the viewport
  myDiagram.addDiagramListener("ViewportBoundsChanged", function(e) {
    var vb = myDiagram.viewportBounds;

    // Update properties of horizontal scale to reflect viewport
    gradScaleHoriz1.graduatedMin = vb.x;
    gradScaleHoriz1.graduatedMax = vb.x + vb.width;
    gradScaleHoriz1.elt(0).width = myColumnHeaders.viewportBounds.width;

    gradScaleHoriz2.graduatedMin = vb.x;
    gradScaleHoriz2.graduatedMax = vb.x + vb.width;
    gradScaleHoriz2.elt(0).width = myColumnHeaders.viewportBounds.width;
  });
}

function initRowHeaders() {
  myDiagram.addDiagramListener("ViewportBoundsChanged", function(e) {
    // Automatically synchronize this diagram's Y position with the Y position of the main diagram, and the scale too.
    myRowHeaders.scale = myDiagram.scale;
    myRowHeaders.position = new go.Point(0, myDiagram.position.y);
  });

  myDiagram.addDiagramListener("DocumentBoundsChanged", function(e) {
    // The row headers document bounds height needs to be the union of what's in this diagram itself and
    // the what's in the main diagram; but the width doesn't matter.
    myRowHeaders.fixedBounds = new go.Rect(0, myDiagram.documentBounds.y, 0, myDiagram.documentBounds.height)
      .unionRect(myRowHeaders.computePartsBounds(myRowHeaders.parts));
  });
}

function initRows() {
  myDiagram.groupTemplateMap.add("Project 1",
  $(go.Group, "Auto",
    $(go.Shape, { fill: "transparent", stroke: "black" }),
    $(go.Placeholder, { padding: 15 }),
    $(go.TextBlock,{
            alignment: go.Spot.Top,
            editable: false,
            margin: 1,
            font: "bold 15px sans-serif",
            opacity: 0.75,
          },
    new go.Binding("text", "GroupText")),
    {
      toolTip:
        $("ToolTip",
          $(go.TextBlock, { margin: 4 },
            new go.Binding("text", "GroupTextTooltip"))
        )
    }
  ));

  myDiagram.model = new go.GraphLinksModel(
    [
        { key: "Project 1",id:"asdadsasdasd", isGroup: true, category: "Project 1", GroupText:"Project 1", GroupTextTooltip:"Project 1" },
        { key: "a", group: "Project 1", row: 3, date: new Date(new Date(2020,04,08,17,40).valueOf()), length: 3, text: "1º Task", color: "lightgreen" },
        { key: "b", group: "Project 1", row: 4, date: new Date(new Date(2020,04,08,17,40).valueOf() + 3 * MillisPerHour), length: 1, text: "2º Task", color: "lightgreen" },
        { key: "c", group: "Project 1", row: 5, date: new Date(new Date(2020,04,08,17,40).valueOf() + 4 * MillisPerHour), length: 7.5, text: "3º Task", color: "yellow" },
        { key: "d", group: "Project 1", row: 6, date: new Date(new Date(2020,04,08,17,40).valueOf() + 16.5 * MillisPerHour), length: 10, text: "4º Task", color: "yellow" },

    ],
    [ // link data
      { from: "a", to: "b" },
      { from: "b", to: "c" },
      { from: "c", to: "d" },
    ]);
}

   function initOverview(){
 myDiagramOverview =
  $(go.Diagram, "myOverviewDiv",
    {
      isReadOnly: true,
      "animationManager.isEnabled": false,
      initialContentAlignment: go.Spot.TopLeft,
      allowHorizontalScroll: false,
      allowVerticalScroll: false,
      allowZoom: false,
      padding:10,
    });


  myDiagramOverview.nodeTemplate =
  $(go.Node, "Auto",
    { locationSpot: go.Spot.Center },
    $(go.Panel, "Vertical",
      { margin: 5 },
      $("Button",
        { margin: 5,
          click: function(e, obj){
            var nodeOverview = obj.part;
            var dataOverview = nodeOverview.data;
            myDiagram.nodes.each(function(node) {
            if (node instanceof go.Group){
                if(node.key == nodeOverview.key){
                   myDiagram.centerRect(node.actualBounds);
                }
              }
            });
          }
        },
        $(go.TextBlock, new go.Binding("text", "ProjectKey"),{
            editable: false,
            margin:5,
            font: "bold 10px sans-serif",
            opacity: 0.75,
        })),
    )
  );

  myDiagramOverview.layout = $(go.GridLayout, { wrappingColumn: 1 });


  var OverviewKeys = [];
  // Create buttons for each isGroup that exists, for better navegation for each Project
  myDiagram.nodes.each(function(node) {
    if (node instanceof go.Group){
      console.log(node.hb.GroupText)
      OverviewKeys.push({key:node.key,ProjectKey:node.hb.GroupText})
    }
  });
  myDiagramOverview.model = new go.GraphLinksModel(OverviewKeys);
  console.log(OverviewKeys)
}


initColumnHeaders();
initRows();
initOverview();
  }
</script>
</head>
<body onload="init()">
  <div style="width: 100%; display: flex; justify-content: space-between">
<div id="myEmptyCorner" style="width: 155px; border: solid 1px white"></div>
<div id="myColumnHeadersDiv" style="flex-grow: 1; height: 40px; border: solid 1px black"></div>
  </div>
  <div style="width: 100%; display: flex; justify-content: space-between">
<div id="myOverviewDiv" style="width: 155px; background-color: whitesmoke; border: solid 1px black"></div>
<div id="myDiagramDiv" style="flex-grow: 1; height: 400px; border: solid 1px black"></div>
  </div>
  <textarea id="mySavedModel" style="width:100%;height:250px"></textarea>
</body>
</html>
Thanks in advance for your time and attention