I still don’t understand whether you just want to toggle the visibility of individual labels or all of them. I’ll assume you want the latter because you want to control them from an HTML button rather than doing something local with an individual label.
I will also take the short-cut in assuming that it’s OK to implement those labels as GoJS objects rather than as Leaflet objects.
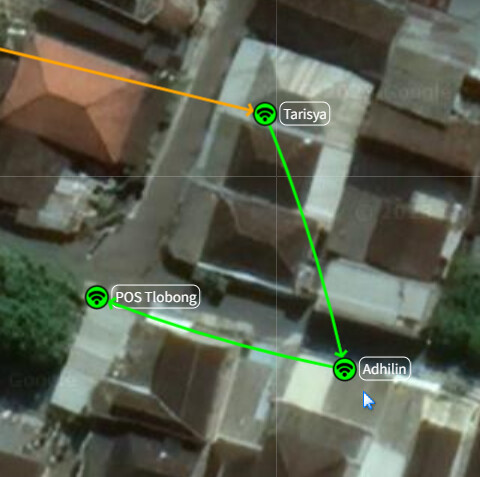
Here’s a stand-alone sample demonstrating adding a yellow label to each node, with the GraphObject.visible property bound to the “labels” property of the shared Model.modelData object. Plus an HTML button to toggle that boolean property.
<!DOCTYPE html>
<html><body>
<div id="sample">
<div id="map" class="mapDiagram">
<div id="myDiagramDiv" class="mapDiagram"></div>
</div>
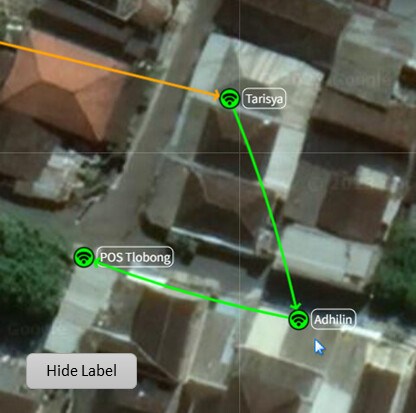
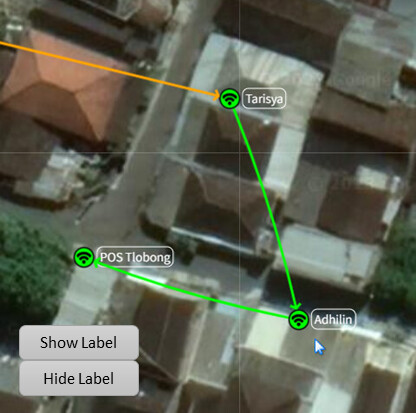
<button onclick="toggleLabels()">Toggle Labels</button>
</div>
<script src="https://unpkg.com/gojs"></script>
<link rel="stylesheet" href="https://unpkg.com/[email protected]/dist/leaflet.css" />
<script src="https://unpkg.com/[email protected]/dist/leaflet.js"></script>
<style type="text/css">
/* CSS applied to the Leaflet map */
.mapDiagram {
border: solid 1px black;
width: 500px;
height: 500px;
}
#myDiagramDiv {
z-index: 701;
}
</style>
<script id="code">
/* Leaflet init */
const defaultZoom = 6;
const defaultOrigin = [50.02185841773444, 0.15380859375];
myLeafletMap = L.map("map", {}).setView(defaultOrigin, defaultZoom);
L.tileLayer("https://api.mapbox.com/styles/v1/{id}/tiles/{z}/{x}/{y}?access_token={accessToken}", {
attribution: '© <a href="https://www.mapbox.com/about/maps/">Mapbox</a> © <a href="http://www.openstreetmap.org/copyright">OpenStreetMap</a>',
maxZoom: 18,
minZoom: 2,
tileSize: 512,
zoomOffset: -1,
id: "mapbox/streets-v11",
accessToken: "pk.eyJ1IjoiZ29qcyIsImEiOiJjaXppcnNkbDgwMzQ3MnFsNDFnY2phb2QwIn0.7AuVKrWdxQnJxa_W7qC3-w"
}).addTo(myLeafletMap);
myLeafletMap.on("zoomend", updateNodes);
myLeafletMap.on("move", updatePosition);
myLeafletMap.on("moveend", updatePosition);
let myUpdatingGoJS = false; // prevent modifying data.latlong properties upon Leaflet "move" events
function updateNodes() { // called when zoom level has changed
myUpdatingGoJS = true;
myDiagram.commit(diag => {
diag.nodes.each(n => n.updateTargetBindings("latlong")); // without virtualization this can be slow if there are many nodes
}, null);
myUpdatingGoJS = false;
}
function updatePosition() { // called when map has been panned (i.e. top-left corner is at a different latlong)
const mapb = myLeafletMap.getBounds();
const pos = myLeafletMap.project([mapb.getNorth(), mapb.getWest()], myLeafletMap.getZoom());
myDiagram.position = new go.Point(pos.x, pos.y);
}
/* GoJS init */
// Since 2.2 you can also author concise templates with method chaining instead of GraphObject.make
// For details, see https://gojs.net/latest/intro/buildingObjects.html
const $ = go.GraphObject.make;
myDiagram = $(go.Diagram, "myDiagramDiv",
{
"InitialLayoutCompleted": e => updatePosition(),
"dragSelectingTool.isEnabled": false,
"animationManager.isEnabled": false,
scrollMode: go.Diagram.InfiniteScroll,
allowZoom: false,
allowHorizontalScroll: false,
allowVerticalScroll: false,
hasHorizontalScrollbar: false,
hasVerticalScrollbar: false,
padding: 0,
defaultCursor: "default",
"toolManager.hoverDelay": 100, // how quickly tooltips are shown
"undoManager.isEnabled": true,
"ModelChanged": e => {
if (e.change === go.ChangedEvent.Transaction &&
(e.propertyName === "FinishedUndo" || e.propertyName === "FinishedRedo")) {
setTimeout(() => updateNodes());
}
},
});
const toolTipTemplate =
$("ToolTip",
$(go.TextBlock, { margin: 4 },
new go.Binding("text", "", d => d.key + "\nlocation: [" + d.latlong.join(", ") + "]"))
);
// the node template describes how each Node should be constructed
myDiagram.nodeTemplate =
$(go.Node, "Spot",
{ toolTip: toolTipTemplate,
locationSpot: go.Spot.Center, locationObjectName: "CIRCLE",
cursor: "pointer"
},
$(go.Shape, "Circle",
{ name: "CIRCLE",
fill: "rgba(0, 255, 0, .4)", stroke: "#082D47", strokeWidth: 1,
width: 7, height: 7,
portId: ""
}),
$(go.Panel, "Auto",
{ alignment: go.Spot.Right, alignmentFocus: new go.Spot(0, 0.5, -4, 0), scale: 0.75 },
new go.Binding("visible", "labels").ofModel(),
$(go.Shape, "RoundedRectangle", { fill: "yellow" }),
$(go.TextBlock, new go.Binding("text", "key"))
),
// A two-way data binding with an Array of latitude,longitude numbers.
// We have to explicitly avoid updating the source data Array
// when myUpdatingGoJS is true; otherwise there would be accumulating errors.
new go.Binding("location", "latlong", data => {
const pos = myLeafletMap.project(data, myLeafletMap.getZoom());
return new go.Point(pos.x, pos.y);
}).makeTwoWay((pt, data) => {
if (myUpdatingGoJS) {
return data.latlong; // no-op
} else {
const ll = myLeafletMap.unproject(L.point(pt.x, pt.y), myLeafletMap.getZoom());
return [ll.lat, ll.lng];
}
})
);
myDiagram.linkTemplate =
$(go.Link,
{ layerName: "Background", curve: go.Link.Bezier, curviness: 5 },
$(go.Shape, { strokeWidth: 3, stroke: "rgba(100,100,255,.7)" })
);
// DraggingTool needs to disable panning of Leaflet map
myDiagram.toolManager.draggingTool.doActivate = function() {
myLeafletMap.dragging.disable();
go.DraggingTool.prototype.doActivate.call(this);
}
myDiagram.toolManager.draggingTool.doDeactivate = function() {
myLeafletMap.dragging.enable();
go.DraggingTool.prototype.doDeactivate.call(this);
}
// create the model data that will be represented by Nodes and Links
myDiagram.model = new go.GraphLinksModel(
{
modelData:
{
labels: true
},
nodeDataArray:
[
// France
{ key: "Paris", latlong: [48.876569, 2.359017] },
{ key: "Brest", latlong: [48.387778, -4.479921] },
{ key: "Rennes", latlong: [48.103375, -1.672809] },
{ key: "Le Mans", latlong: [47.995562, 0.192413] },
{ key: "Nantes", latlong: [47.217579, -1.541839] },
{ key: "Tours", latlong: [47.388502, 0.694500] },
{ key: "Le Havre", latlong: [49.492755, 0.125278] },
{ key: "Rouen", latlong: [49.449031, 1.094128] },
{ key: "Lille", latlong: [50.636379, 3.070620] },
// Belgium
{ key: "Brussels", latlong: [50.836271, 4.333963] },
{ key: "Antwerp", latlong: [51.217495, 4.421204] },
{ key: "Liege", latlong: [50.624168, 5.566008] },
// UK
{ key: "London", latlong: [51.531132, -0.125132] },
{ key: "Bristol", latlong: [51.449541, -2.581118] },
{ key: "Birmingham", latlong: [52.477405, -1.898494] },
{ key: "Liverpool", latlong: [53.408396, -2.978809] },
{ key: "Manchester", latlong: [53.476346, -2.229651] },
{ key: "Leeds", latlong: [53.795480, -1.548345] },
{ key: "Glasgow", latlong: [55.863287, -4.250989] },
],
linkDataArray:
[
{ from: "Brest", to: "Rennes" },
{ from: "Rennes", to: "Le Mans" },
{ from: "Nantes", to: "Le Mans" },
{ from: "Le Mans", to: "Paris" },
{ from: "Tours", to: "Paris" },
{ from: "Le Havre", to: "Rouen" },
{ from: "Rouen", to: "Paris" },
{ from: "Lille", to: "Paris" },
{ from: "London", to: "Lille" },
{ from: "Lille", to: "Brussels" },
{ from: "Brussels", to: "Antwerp" },
{ from: "Brussels", to: "Liege" },
{ from: "Bristol", to: "London" },
{ from: "Birmingham", to: "London" },
{ from: "Leeds", to: "London" },
{ from: "Liverpool", to: "Birmingham" },
{ from: "Manchester", to: "Liverpool" },
{ from: "Manchester", to: "Leeds" },
{ from: "Glasgow", to: "Manchester" },
{ from: "Glasgow", to: "Leeds" }
]
});
function toggleLabels() {
myDiagram.model.commit(m => m.set(m.modelData, "labels", !m.modelData.labels));
}
</script>
</body></html>