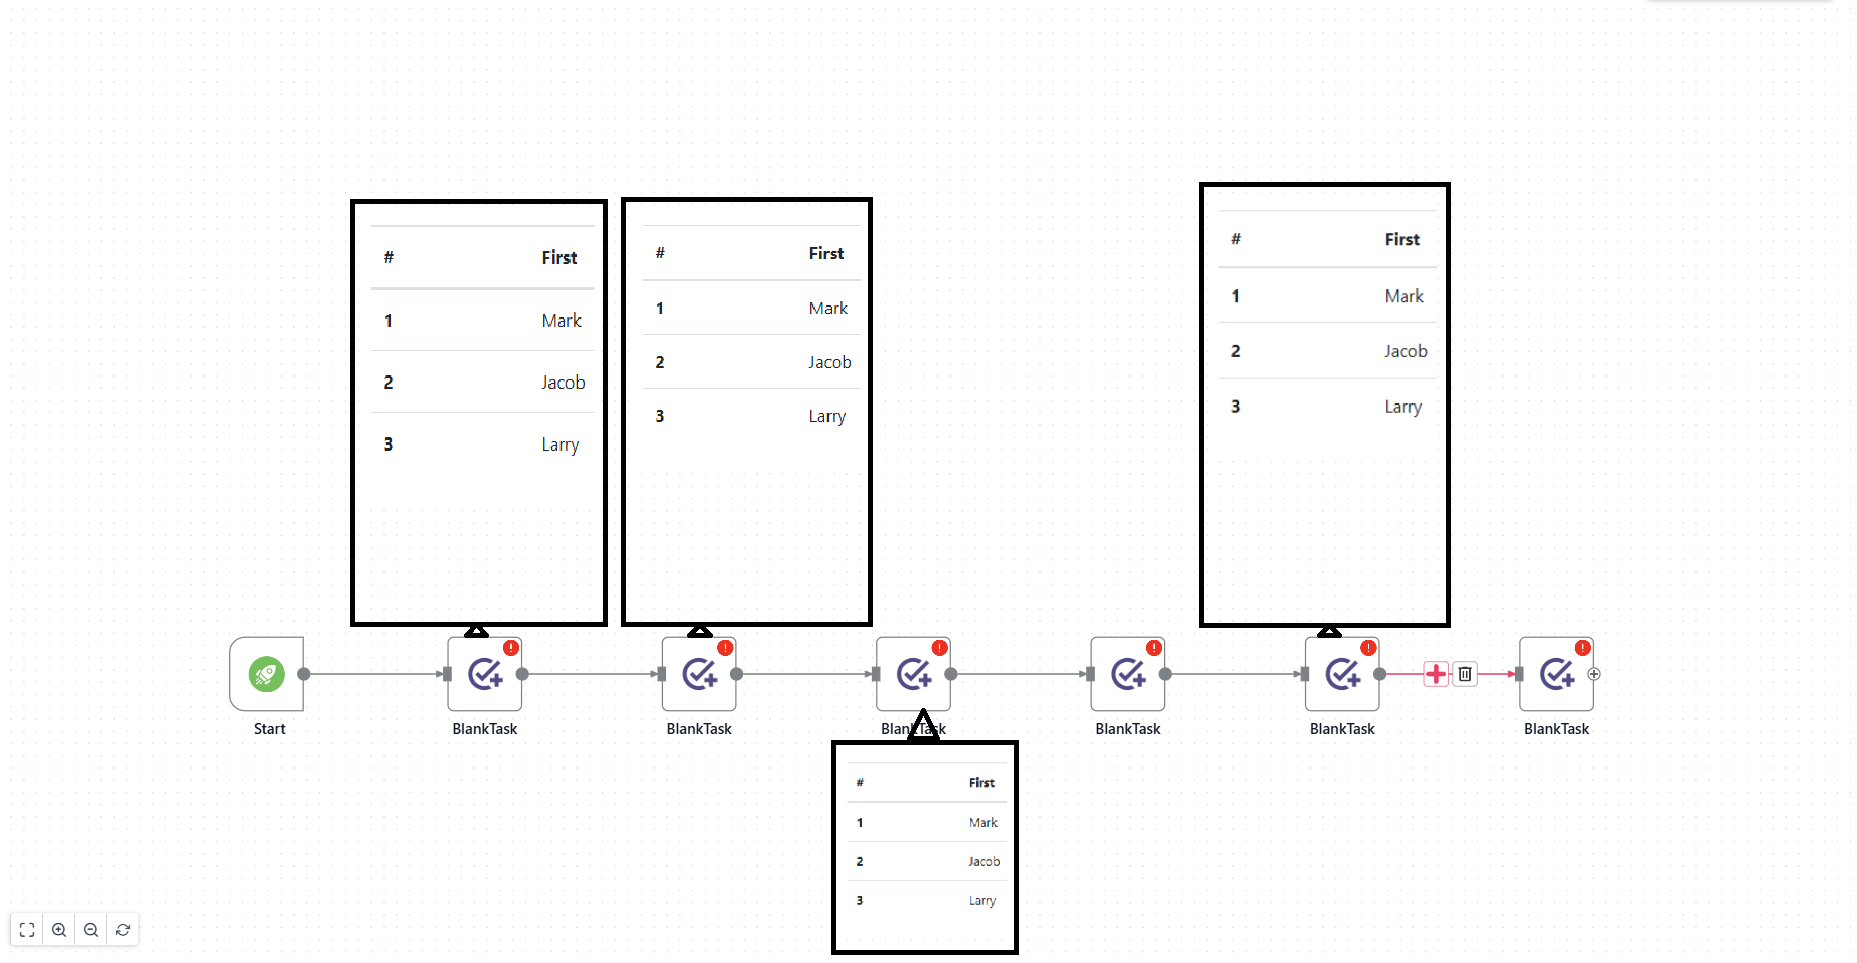
I need a GoJS diagram that shows a temporary ‘live data’ node. When the live data ends, the node should be hidden or removed from the diagram. Also, each node should support expanding to show more details.
So you do want those “live data” panels to be visible for different nodes at the same time, yes? And each showing different data, not the same as your screenshot shows?
Are the “more details” that you are talking about the same as the “live data”, or are they different? The normal way to let the user show or hide a Panel in your Node is to use a “PanelExpanderButton”, Buttons | GoJS
Yes i want a panel to show live logs details but i dont want to interrupt node , i want panel beside node or top or bottom of node where space is available .
OK, assuming your “more details” is the same as the “live data”, then I suggest that you use an Adornment for each Node to show that “live data”. That way if the Node moves around, either by layout or by the user moving it, the “live data” Adornment will move with it.
I can work on an example for you later today.
Ok, Sure but used already selectionAdornmentTemplate
Did you want to use highlighting as well (apart from showing live data)? Highlighting | GoJS
No, I just used it to Highlighting the node.
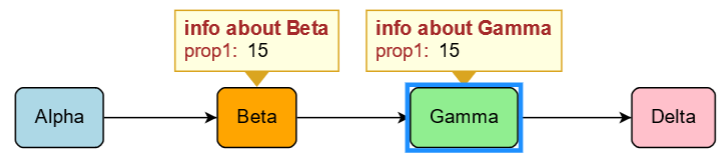
Try this, which doesn’t use Adornments but just toggles the visible property of the “INFO” Panel of each Node.
The result, after clicking on the Beta and the Gamma nodes:
<!DOCTYPE html>
<html lang="en">
<body>
<div id="myDiagramDiv" style="border: 1px solid gray; width: 100%; height: 400px;"></div>
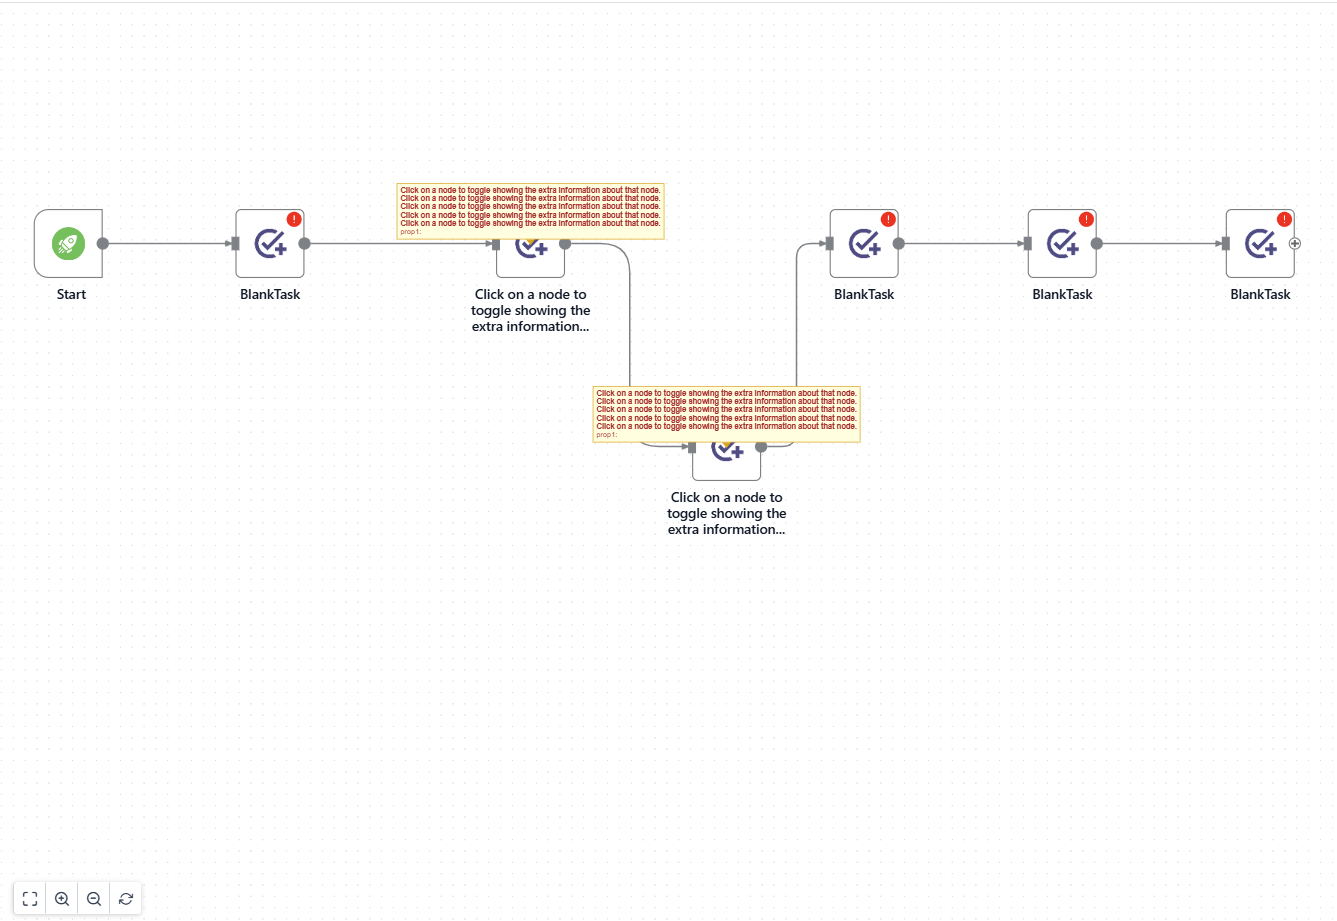
Click on a node to toggle showing the extra information about that node.
You might want to use a different mechanism for the user to say that they want to see or hide the info.
<br>
The `data.prop1` property of each node is changing every second.
<script src="https://cdn.jsdelivr.net/npm/[email protected]/release/go-debug.js"></script>
<script id="code">
myDiagram = new go.Diagram('myDiagramDiv', {
layout: new go.TreeLayout({ layerSpacing: 75 }),
"undoManager.isEnabled": true
});
myDiagram.nodeTemplate =
new go.Node("Spot", {
selectionObjectName: "BODY",
locationSpot: go.Spot.Center, locationObjectName: "BODY",
layoutConditions: go.LayoutConditions.Standard & ~go.LayoutConditions.NodeSized,
click: (e, node) => {
const info = node.findObject("INFO");
if (!info) return;
e.diagram.commit(d => {
info.visible = !info.visible;
});
}
})
.add(
new go.Panel("Auto", { name: "BODY" })
.add( // the details don't really matter here
new go.Shape('RoundedRectangle', { fill: "white", portId: "" })
.bind("fill", "color"),
new go.TextBlock({ margin: 10 })
.bind("text")
),
new go.Panel("Vertical", {
name: "INFO", visible: false,
alignment: go.Spot.Top, alignmentFocus: go.Spot.Bottom,
})
.add(
new go.Panel("Auto")
.add( // put the live data here that you want
new go.Shape({ fill: "lightyellow", stroke: "goldenrod" }),
new go.Panel("Table", { margin: 6 })
.addColumnDefinition(1, { width: 6 })
.add(
new go.TextBlock({ row: 0, columnSpan: 9, font: "bold 10pt sans-serif", stroke: "brown" })
.bind("text", "prop2"),
new go.TextBlock("prop1:", { row: 1, column: 0, alignment: go.Spot.Right, stroke: "brown" }),
new go.TextBlock({ row: 1, column: 2, alignment: go.Spot.Left })
.bind("text", "prop1")
)
),
new go.Shape("TriangleDown", { width: 16, height: 10, fill: "goldenrod", strokeWidth: 0 })
)
);
myDiagram.model = new go.GraphLinksModel(
[
{ key: 1, text: "Alpha", color: "lightblue", prop1: 17, prop2: "info about Alpha" },
{ key: 2, text: "Beta", color: "orange", prop1: 23, prop2: "info about Beta" },
{ key: 3, text: "Gamma", color: "lightgreen", prop1: 79, prop2: "info about Gamma" },
{ key: 4, text: "Delta", color: "pink", prop1: 13, prop2: "info about Delta" }
],
[
{ from: 1, to: 2 },
{ from: 2, to: 3 },
{ from: 3, to: 4 }
]);
function loop() {
myDiagram.model.commit(m => {
m.nodeDataArray.forEach(d => {
m.set(d, "prop1", Math.round(Math.random() * 100));
})
}, null); // skipsUndoManager
setTimeout(loop, 1000);
}
loop();
</script>
</body>
</html>
Did you have a question? Please explain the problem and desired solution in a manner that I can understand.
Let me guess about one solution: comment out the setting of the Part.layoutConditions property.