Ideas on data visualisation

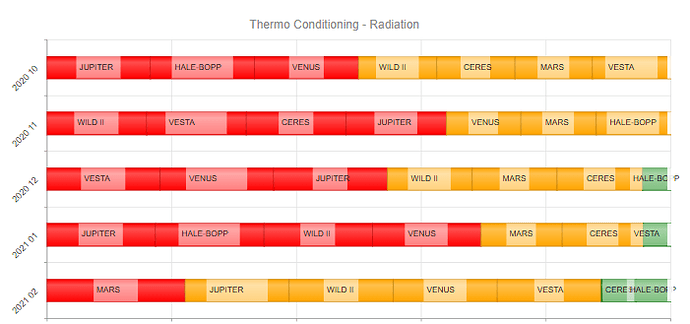
Hi, I’m wondering if you guys would have any ideas on what would be a good approach to representing data that highlights the condition of items over time but where the ‘health’ of each item in the series dictates it’s position in the visualisation. It’s quite hard to explain but I’ll try…if we were alanysing the radiation exposure of planets over time we could give them a score 1=OK (green), 2=Warning (amber), 3=Critical(red). If for January Mars was critical it would appear first in the visualisation and red in colour. If in February it’s exposure changed to OK and Venus was critical, Venus would appear first and red with Mars later in the series and green. We’ve been attempting to model this using a stacked bar but have got to a point where we think using GoJS and a visualisation rather than trying to make a chart do something it’s not designed for might be a better appoach. There would be multiple ‘charts’ on the page for different conditions, say, radiation, solar wind speed, spin velocity (making things up here!)…

Do you have any ideas / suggestions on an approach - such as which diagram / chart might be good starting point - more than happy to receive any ideas on alternate visualisations. Here’s an example of one chart we’ve been working towards and the point at which we started thinking we’re trying to fit a big old round peg into a small square hole!!
In what format is the data? It’s always good to know how it is structured and what properties there are.

What interactivity is desired?

<!DOCTYPE html>
<html>
<head>
  <title>Minimal GoJS Sample</title>
  <!-- Copyright 1998-2021 by Northwoods Software Corporation. -->
  <script src="https://unpkg.com/gojs"></script>
  <script id="code">
  function init() {
    var $ = go.GraphObject.make;

    myDiagram =
      $(go.Diagram, "myDiagramDiv",
        {
          "undoManager.isEnabled": true,
          layout: $(go.GridLayout, { wrappingColumn: 1 })
        });

    var Colors = [
      $(go.Brush, "Linear", { 0: go.Brush.lighten("red"), 1: go.Brush.darken("red") }),
      $(go.Brush, "Linear", { 0: go.Brush.lighten("yellow"), 1: go.Brush.darken("yellow") }),
      $(go.Brush, "Linear", { 0: go.Brush.lighten("green"), 1: go.Brush.darken("green") })
    ];

    var DateFormat = new Intl.DateTimeFormat([], { dateStyle: "medium", timeZone: "UTC" });

    myDiagram.nodeTemplate =
      $(go.Node, "Table",
        $(go.TextBlock,
          { column: 0, margin: 4 },
          new go.Binding("text", "date", function(d) {
            if (typeof d === "number") d = new Date(d);
            return DateFormat.format(d);
          })),
        $(go.Panel, "Horizontal",
          {
            column: 1,
            itemTemplate: $(go.Panel, "Auto",
              $(go.Shape,
                { stroke: "white", strokeWidth: 0.5, width: 40, height: 30 },
                new go.Binding("fill", "crit", function(c) { return Colors[c-1]; }),
                new go.Binding("width", "val")),
              $(go.TextBlock,
                new go.Binding("text"))
            )
          },
          new go.Binding("itemArray", "values", function(a) {
            a.sort(function(d1, d2) { return d1.crit - d2.crit; });
            return a;
          })
        )
      );

    function R() { return 40 + Math.random() * 20; }

    myDiagram.model = new go.GraphLinksModel(
    [
      {
        date: Date.UTC(2021, 1, 1),
        values: [
          { text: "Alpha", crit: 1, val: R() },
          { text: "Beta", crit: 1, val: R() },
          { text: "Gamma", crit: 2, val: R() },
          { text: "Delta", crit: 3, val: R() },
          { text: "Epsilon", crit: 2, val: R() },
          { text: "Zeta", crit: 1, val: R() },
          { text: "Eta", crit: 2, val: R() },
          { text: "Theta", crit: 3, val: R() }
        ]
      },
      {
        date: Date.UTC(2021, 2, 1),
        values: [
          { text: "Alpha", crit: 2, val: R() },
          { text: "Beta", crit: 1, val: R() },
          { text: "Gamma", crit: 3, val: R() },
          { text: "Delta", crit: 2, val: R() },
          { text: "Epsilon", crit: 1, val: R() },
          { text: "Zeta", crit: 2, val: R() },
          { text: "Eta", crit: 3, val: R() },
          { text: "Theta", crit: 3, val: R() }
        ]
      },
      {
        date: Date.UTC(2021, 3, 1),
        values: [
          { text: "Alpha", crit: 3, val: R() },
          { text: "Beta", crit: 1, val: R() },
          { text: "Gamma", crit: 2, val: R() },
          { text: "Delta", crit: 3, val: R() },
          { text: "Epsilon", crit: 2, val: R() },
          { text: "Zeta", crit: 3, val: R() },
          { text: "Eta", crit: 2, val: R() },
          { text: "Theta", crit: 1, val: R() }
        ]
      },
    ]);
  }
  </script>
</head>
<body onload="init()">
  <div id="myDiagramDiv" style="border: solid 1px black; width:100%; height:600px"></div>
</body>
</html>

produces: