How to make a bar chart with X-Axis and Y-axis, and how to give our own values to the Y-axes.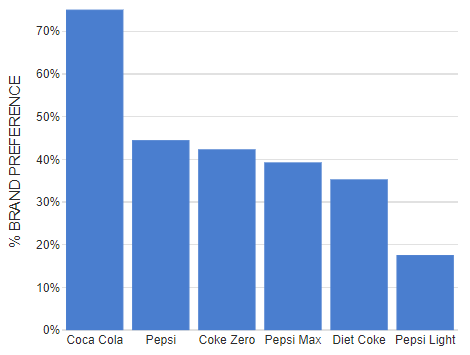 .
.
I want to create a bar graph exactly look like this. please share the code.
How to make a bar chart with X-Axis and Y-axis, and how to give our own values to the Y-axes. .
I want to create a bar graph exactly look like this. please share the code.
Have you seen the Bar Charts sample? You could expand upon that to add a vertical axis, maybe with a graduated panel.
Thanks Jhardy, yes, I saw the bar charts samples and I tried the [graduated panel] also, but I’m unable to get the Y -AXIS.
(GoJS Graduated Panels -- Northwoods Software)
It might be easier to use a separate charting library. Take a look at: Various Charts in GoJS Nodes