Implementation suggestions for complex swimlane diagram

Hello,

I need to implement a kind of swimlane diagram, however it is more complex than the swimlane example, as the swimlane has connections to other nodes:

SW-Example

I’ll try to summarize which components I would use for it. Would be great if you could tell me if this is the way to go or if there are other, better suited components available.

  • The upper elements would be normal nodes using a table panel and ports.
  • The bottom element would be a swimlane consisting of one group with two lanes. The first lane has 6 nodes and the second lane has 3 nodes (using a GridLayout?).
  • Now I need a horizontal line/link starting at the nodes goint to the right but without a destination node. How would I do this? The end of the line should be at the end of the last upper node… (maybe an invisible node as the target?)
  • Then I guess I could use Links to Links to connect the upper elements to the swimlanes.

Do you think this would work? Do you see any difficulties trying to create such a diagram with goJS? Any other resources/example I could study?

Best regards,
Dominic

I would not bother using Groups as the swim lanes. Use a “Grid” Panel to draw a regular set of horizontal lines.

Within that area, which I’ll call a connection matrix, those black circles could be port objects connected with Links to the ports/Nodes above. However that design isn’t necessarily the best, since I don’t understand why there are some dashed lines that are always at the bottom.

How is the source data organized? That will affect how you organize the GraphLinksModel.

Also, you haven’t given any hints regarding how the diagram might change dynamically. Might some of the data change on its own? If so, how? Is this app meant to be an editor? If so, what changes may the user make?

Hi Walter,
thanks for your reply. I’ll try to elaborate a bit more:

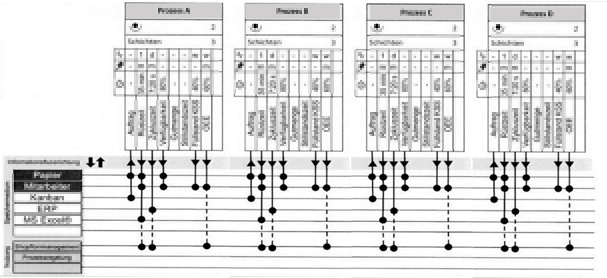
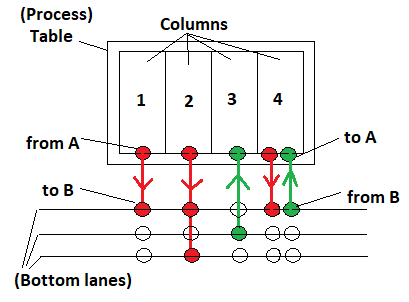
Let’s call the 4 boxes at the top “Processes”, where each process has a set of parameters (each vertical line is connected to a parameter). The processes (with an initial set of parameters) are automatically added initially (layed out horizontally) and cannot be moved manually.

Each parameter of a process can be linked to one or more horizontal lines on the connection matrix. The links to the connection matrix will always be vertical. The dashed line is displayed if a parameter connects to the second block (in gray) of the connection matrix (therefore it can be determined dynamically if a link should be displayed dashed or continuous).

The data structure is not defined yet, I would assume something like this:

Processes:

[{
    name: "ProcessA"
    parameters: [{
        name: "ParameterA",
        value: 17,
        ...
      }, {
        name: "ParameterB",
        value: 13,
        ...
      }]
}]

Swimlanes:

[{
    name: "Lane1"
    block: "top"
  }, {
    name: "Lane2"
    block: "top"
  }, {
    name: "Lane3"
    block: "bottom"
  }]

And some way to link a parameter to a swimline:

{
fromProcess: "ProcessA",
fromPort: "ParameterA",
to: "Lane1",
direction: "fromProcessToLane"
}

However this is not fixed, I think we can adjust to what’s best to use with goJS.
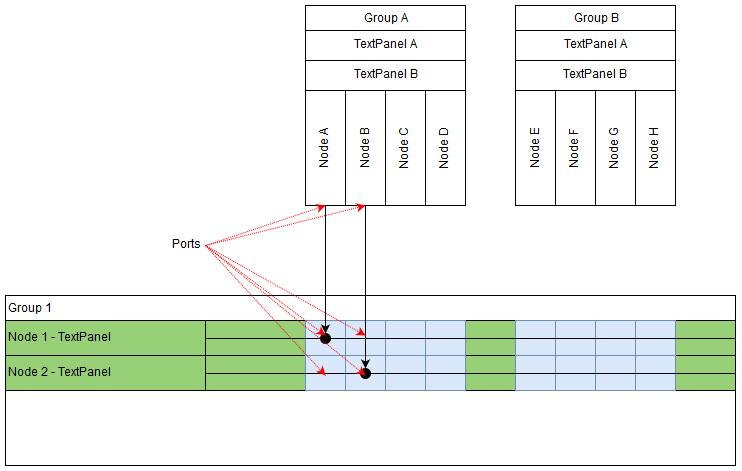
We would now need a link from one parameter of a process to a swimlane (or the other way, these are directed links).

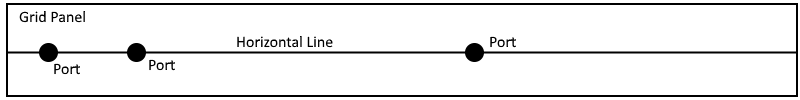
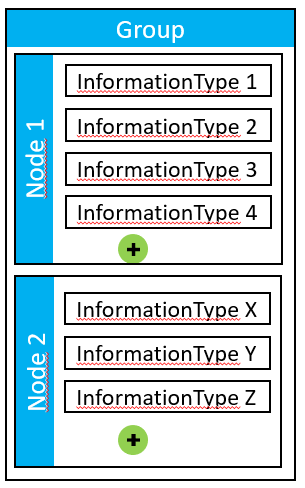
What I don’t understand here yet, the ports on the connection matrix should belong to some part/node? Which node would that be? Would I have a Grid panel over the complete width and just draw a horizontal line in the center of this grid panel, and then the ports would belong to the gridPanel and be centered, like this:

The location of the ports of the processes would be defined by the parameters. The ports on the connection matrix I would add dynamically I assume, so that they are aligned with the parameter ports?

The user can do the following in the diagram:

  • Add a link from a parameter to a swimlane or vice versa (only vertically)
  • Delete a link
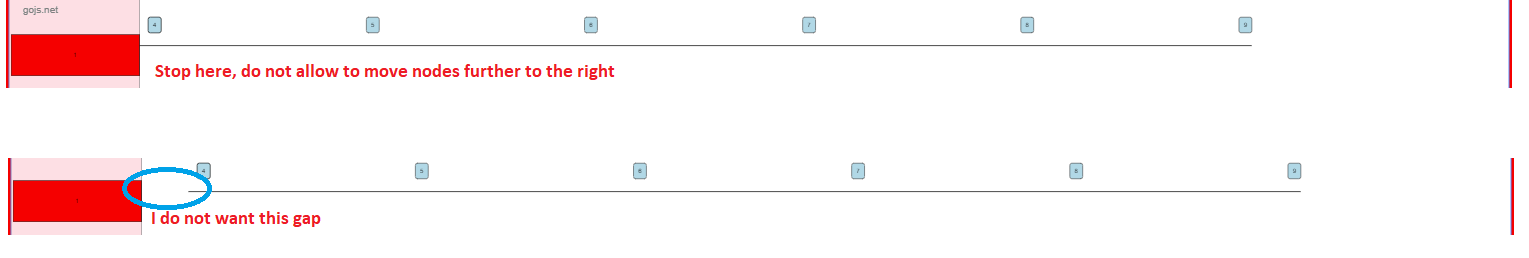
  • Add/Remove a Parameter to/from a process (which would shift all right-hand processes a bit)
  • Add/remove a swimlane

Whatever the user does needs to be persisted, so the next time he opens the diagram it should be in the same state.

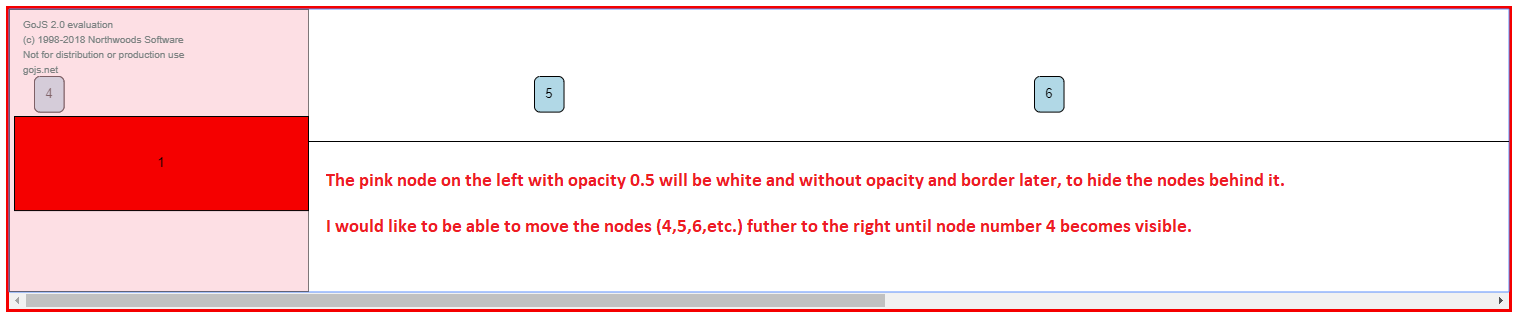
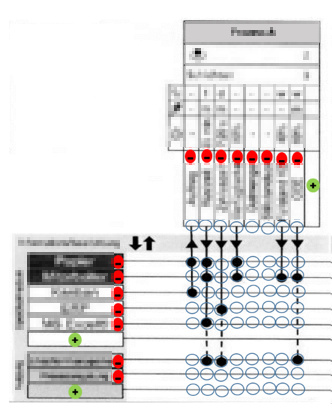
Here is a better example of the interaction possibilities (this is just a mockup, doesn’t have to look exactly like this):
grafik

Adding/removing a parameter is probably a little bit more complex, as when the processes shift to the right or left, I need to recalculate the grid panel width of the swimlane as well as the new swimlane port positions.

Any ideas how to realizes this in the most reasonable way is highly appreciated.

Thanks, Dominic

OK, I think we agree about how to implement each “Process” Node. And you seem to have enough experience to be able to implement it without too much effort.

I was suggesting that each thing that you were assuming would be a “swim lane” should instead just be a Node, occupying a horizontal stretch with a vertical panel on the left. Each such Node would have a “connection matrix” area on the right, consisting of a “Grid” Panel stretching as far as needed. That means horizontally to cover the area occupied by the “Process” nodes, and vertically to cover the items in the “Vertical” Panel on the left.

Then you would implement each “connection” as a small black “Circle” Shape that would act as a port element. You would position those circular ports at the intersection points.

It isn’t clear to me whether the top row under the “Process” nodes is itself a special Node stretched horizontally and holding arrows, or whether it’s just a fixed Part with decorations and the up and down arrows (other than the two furthest left) are decorations (labels) on the Links. I would guess the latter is the best course of action.

What are those red ellipses? Are those to delete that “parameter” or that whatever-you-want-to-call-that-horizontal-line-of-the-nodes-on-the-bottom? (You need better terms for things down there.)

I understand that the blue circles are where there might be circular connections made, but you don’t expect them to all exist simultaneously, do you? It seems that whenever the user starts drawing a new link from a Process parameter than only those available connection points should be shown in that vertical column. And perhaps at most one at a time – the one that would be made if the user did a mouse-up.

Initially you might not want to bother to implement your own custom Layout to position the Process nodes and the nodes on the bottom, but in the long run I recommend that you do so. It would be responsible for stretching those bottom nodes the correct length towards the right.

In some respects this is very similar to how the Sequence Diagram is implemented, Sequence Diagram, except it is turned around 90 degrees and the “sequence diagram activity” nodes are just simple small circular ports rather than separate nodes. So this seems simpler than the Sequence Diagram.

Hi Walter,
thanks for the detailed reply! The explanation about the matrix layout is most valuable, as this was/is the most unclear point to me.

Let’s call a lane at the bottom a category, with basically the category labels on the left and a horizontal line on the right side of each label. So there are a total of seven (or nine, if the two empty categories are counted) categories in two groups in the example.

So just that I understand you correctly, how much nodes would you expect to exist in the above example (except for the process nodes)? Two nodes (one for each group of categories) or seven/nine nodes (one node for each category)? Or is it just a matter of preference?

Yes, the red ellipises are to delete a complete horizontal item/lane (Maybe let’s call it category, so one parameter can be connected to multiple categories). I think I will be able to figure something out using adornments, unless you disagree :-). The green ellipses are used to add a new category lane.

I understand that the blue circles are where there might be circular connections made, but you don’t expect them to all exist simultaneously, do you? It seems that whenever the user starts drawing a new link from a Process parameter than only those available connection points should be shown in that vertical column. And perhaps at most one at a time – the one that would be made if the user did a mouse-up.

Well, this is not yet exactly specified, but basically something like your suggestion sounds reasonable. I’ll try to implement it and come back to you in case of any questions.

Initially you might not want to bother to implement your own custom Layout to position the Process nodes and the nodes on the bottom, but in the long run I recommend that you do so. It would be responsible for stretching those bottom nodes the correct length towards the right.

Haven’t worked with layouts yet, but this sounds like a reasonable way to go. Will have a look.

I think based on this I can soon start the implementation (and probably I’ll come back with more questions later).
Thanks for your suggestions and support!

Your mention of Adornments implies that the user has to select the node for the red ellipse button to appear. That’s OK if that’s what you want, but I think it’s more common to have those delete buttons (and the add button too) always be present. You might want to have the opacity of those delete buttons be 0.0 by default, and have a mouseEnter event handler change the opacity to 1.0 and a mouseLeave event handler change it back to 0.0.

Whether each category is a Node with a variable number of items in it, each of which has a horizontal line that might hold a port, or whether there are a bunch of Nodes in a Group, and each Node has a single horizontal line with some number of ports, depends on how you want to organize your model. I cannot make that judgement for you.

I suppose it’s easier to select an individual horizontal item/line if it is a separate Node – you then might not even need to have any red “delete” button because the normal delete command would work. But on the other hand, there’s more management needed to have separate Group objects/data. And yet if you want to allow the user to move or delete or copy the collection of categories, then having a Group would be helpful.

Hello Walter,

thanks for your advice. I’ve tried to work out the model and layout based on your suggestions and our requirements (simplified):

Model:

nodeDataArray = [
	{
		category: "process",
		isGroup: true,
		name: "Group A",
		attributes: [{
			name: "TextPanel A",
		},
		{
			name: "TextPanel B",
		}]
	},
	{
		category: "parameter"
		group: "Group A",
		name: "Node A",
	},
	{
		category: "parameter"
		group: "Group A",
		name: "Node B",
	},
	{
		category: "swimlane"
		name: "Group 1",
		isGroup: true
	}
	{
		category: "informationType"
		name: "Node 1",
		group: "Group 1"
	},
	{
		category: "informationType"
		name: "Node 2",
		group: "Group 1"
	}
	
]

linkDataArray = [
	{
		from: "Node A",
		to: "Node 1",
		toPortId: "Node A"
	},
	{
		from: "Node B",
		to: "Node 2",
		toPortId: "Node B"
	}
]

Note:
I have renamed what I’ve previously called “category” to “informationType” in order to avoid confusion with the goJS category attribute. Also, maybe I’ll eventually remove the Group 1 and only use a Grid panel as you’ve suggested above but I’ll leave it in here for now.

One more question about the linking and layout:

On Node A I have a single port at the bottom.
On Node 1, I have one port for each parameter node. The position of the first port on Node 1 is therefore determined by the position of Node A.

Node A can only be linked to Node 1 or/and Node 2 (both directions).

First I thought I could add a portId (toPortId) to the linkDataArray with the node name/key of parameter node. This way, I could create panels within the informationType node with the GraphObject.portId property set to the key of the parameter node.
However, the number of panels (the blue boxes) depend on the number of nodes in the upper groups. And as the panels are defined in a template, I don’t know yet how many upper nodes exists. This is what you mean when talking about a variable number of items in a node, right? I would need an array of items for each parameter node into my informationType node data in order to link it to the template. While this is not in our data structure, I could theoretically add it.

However I guess it would be easier to just use a single panel for each informationType node and after adding all upper parameter nodes to add the ports dynamically to the informationType nodes like in this example.

These are the two approaches you described above, correct?

there’s more management needed to have separate Group objects/data

You mean managing the nodeDataArray would be more difficult because it would contain both groups and normal nodes?

Best regards
Dominic

Yes, consider this sample: Network Configuration
Each “Horizontal Bar” node has only a single port. The custom BarLink class routes vertically to the closest point on the HBar node. The link template doesn’t include any arrowheads, but you could have them if you want. That would avoid having to have separate ports on the horizontal nodes.

Yes, I was referring to the extra work involved in dealing with a Group as well as with its member Nodes. But it could be worth it if you want the user to be able to select, move, copy those Nodes.

Hello @walter,
I have a new requirement which is that the labels of the informationTypes (“Node 1 - TextPanel”, “Node 2 - TextPanel” …) should always be visible if the user scrolls the diagram horizontally.
The reason is that there will be many process nodes (the nodes at the top) and if the user scrolls far to the right, he should still be able to see the informationType Labels.
Basically we need a similar functionality to the “Freeze column” functionality in Excel.
Do you have any suggestion what goJS feature I could for this requirement?

P.S: I haven’t started implementing yet so I could still change the concept if necessary.

What did you implement to address the original topic?

Nothing yet, I was just about to start.

Ah, so that was what you meant. OK, I suggest that you implement the things that should not scroll as one or more separate Parts: GoJS Legends and Titles -- Northwoods Software

1 Like

Hello @walter,

I have implemented the Process nodes. I have also tried your suggestion with StaticParts.
The result is a strange scrolling behavior. I have reproduced it here:
codepen
Here is the code of the example:

  function init() {
    var $ = go.GraphObject.make;
    myDiagram = $(go.Diagram, "myDiagramDiv",
                  {initialContentAlignment: go.Spot.Center,"undoManager.isEnabled": true});

    myDiagram.nodeTemplate =
      $(go.Node, "Auto", 
        $(go.Shape, "RoundedRectangle", { fill: "lightblue" }),
        $(go.TextBlock, { margin: 8 }, new go.Binding("text", "text"))
      );
    
    myDiagram.addDiagramListener("ViewportBoundsChanged", (e) => 
    {
      let dia = e.diagram;
      let node = dia.findNodeForKey(1);
      node.location = dia.transformViewToDoc(new go.Point(10, 150)); // try different x values: 0, 5, 10 
    });
    
    myDiagram.model = new go.GraphLinksModel(
    [
      { key: 1, text:"Alpha", color: "lightblue" },
      { key: 2, text:"Beta", color: "orange" },
      { key: 3, text:"Gamma", color: "lightgreen" },
      { key: 4, text:"Delta", color: "pink" }
    ]);

  }
init();

If you move the nodes to the left, then there is a delay. It also depends on the zoom and location of nodes.
Also if you change the x value of the static part from 10 to 0 or 5 the behaviour becomes even more strange.

The StaticParts example uses a go.Part instead of a go.Node. But I need to use nodes for the informationType items and their horizontal lines.

Any ideas how this can be solved?

It’s OK if it’s a Node rather than a Part.

I suspect that the reason is at least partially due to the chosen Node being part of the document, thereby always contributing to the computation of the Diagram.documentBounds.

If you use a separate template or bind Part.isInDocumentBounds so that the value is false for your chosen Node, I think the behavior would be better.

Note that the example in GoJS Legends and Titles -- Northwoods Software has the chose Part in the “Grid” Layer, which both avoids having it be in the document bounds and also avoids recording its changes to the UndoManager.

Hello @walter,

thanks. Both suggestions solve the scrolling problems.

node.layerName = "Grid";

OR

node.isInDocumentBounds = false; 

Setting the layerName to “Grid” has the effect that the “static” node will be behind all other nodes, no matter which zOrder is set.
So I will use isInDocumentBounds and set the layerName to “Foreground” or set zOrder.

I have updated the example here: link
Which brings me to the next two questions about scrolling:

  1. When the most left node comes into view, I cannot move the nodes further to the right. The pink panel will be without opacity later and will hide the nodes behind it. So I need to move the nodes to the right until all nodes become visible.

  2. The horizontal black line is a node, which will have ports later. I want to limit the scroll position, so that I can avoid the gap shown in the image below. That means the x location of the line should always be equal or smaller than the width of the pink panel. (but of course without modifying the x location itself, because it is related to the other nodes). I want to limit the scroll position.

You can control where the user can scroll. Have you read GoJS Coordinate Systems-- Northwoods Software and seen Scroll Modes GoJS Sample ?

Thanks Walter,

I have solved the first point by setting the line x-location and moving the process nodes to the right.
I solved the second point by handling the positionComputation event. Thank you.

The next step is to group multiple static parts. When I add multiple static nodes to a group, the group is created around the nodes. When I try to set the group location in my code, then the group is moved, but the nodes remain on their locations. You can see this behavior here: link. When you move the node 2 or 3 the group is redrawn again around the nodes 2 and 3.

I have also tried, to set the “Vertical” type and also tried to add a GridLayout to the group. But the nodes are still not placed into the group.
The Group Templates example here also sets the “Vertical” type on the group, but the nodes within the group are aligned horizontally.

I would like to define a location and a width for the group. Then all nodes assigned to the group should be aligned vertically within the group. Like it is done in a vertical panel, without the need to calculate the location of each element. How can I do this?

image
In this image, both nodes are aligned vertically and the height of the nodes can change, so the second node should always start below the first node.

If you want to move a Group, call Group.move.

For the second scenario, is it sufficient to just set Group.layout to a GridLayout whose GridLayout.wrappingColumn is set to 1?

Hello Walter,

Group.move did the trick .
(Setting group location like described on static parts does not move the content of the group.)

I am quite close to what I want at the end, but now I have two questions about links/ports:
Question 1:
I have two types of ports.

  • The ports on the process nodes (Type A)
  • The ports on the bottom lanes (Type B)

I want to allow only connections from A to B or from B to A.
But not from A to A nor B to B.

I have found an example (Grafcet Diagrams) which uses categories and overrides the linking tool to define which category the new link gets.

But I think for such a simple limitation, there is another solution. Something which can be “hardcoded” in the model or the template. Is there an easier solution?

Question 2:
A process node contains a table where each column (see image below) can have multiple links to the bottom lanes or the other way.
image
If there are only links from A to B (red) or only links from B to A (green) then the link and port should be located in the middle of the column.
But if there are green and red links (like in column 4) then the links and ports should be located at about 33% and 66% of the columns width.
What is the best way to achieve that?

(btw. Column 2 has two downward links, because there are two filled circles at the first and last lane.)

Thank you in advance

#1 The default valid linking behavior, GoJS Validation -- Northwoods Software, disallows reflexive links.

#2 Set fromSpot and toSpot to go.Spot.BottomSide for port A and go.Spot.TopSide for port B.