Try this: [EDIT: fixed a bug]
<!DOCTYPE html>
<html>
<head>
<title>Isometric View</title>
<!-- Copyright 1998-2026 by Northwoods Software Corporation. -->
<meta name="description" content="Isometric projection and grid">
<meta name="viewport" content="width=device-width, initial-scale=1">
</head>
<body>
<div style="width: 100%; display: flex; justify-content: space-between; gap: 10px;">
<div style="flex-flow: column wrap; flex-grow: 0.6667;">
<b>Isometric View:</b>
<div id="myIsoDiagramDiv" style="height: 600px; border: solid 1px black"></div>
</div>
<div style="flex-flow: column wrap; flex-grow: 0.3333;">
<b>Cartesian View:</b>
<div id="myDiagramDiv" style="height: 600px; border: solid 1px black"></div>
</div>
</div>
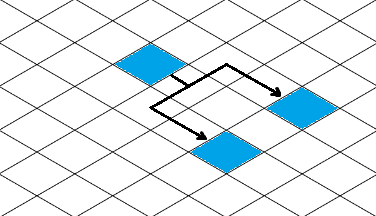
You can move, copy, or delete Nodes in either view.
Note how reshaping or resegmenting a link in the normal Cartesian view is reflected in the Isometric view.
Link reshaping or resegmenting is not enabled in the Isometric view because the LinkReshapingTool would
need to know how to handle the isometric view.
<textarea id="mySavedModel" style="border: solid 1px black; width:100%; height:300px"></textarea>
<script src="https://cdn.jsdelivr.net/npm/gojs"></script>
<script id="code">
const CELL = 20;
const Stringify = go.Point.stringifyFixed(1);
// The normal diagram view
myDiagram =
new go.Diagram("myDiagramDiv", {
grid:
new go.Panel("Grid", { gridCellSize: new go.Size(CELL, CELL) })
.add(
new go.Shape("LineH", { stroke: "lightgray" }),
new go.Shape("LineV", { stroke: "lightgray" })
),
layout: new go.TreeLayout({
angle: 90,
layerSpacing: CELL*2, nodeSpacing: CELL,
arrangement: go.TreeArrangement.Horizontal
}),
"draggingTool.isGridSnapEnabled": true,
"draggingTool.gridSnapCellSize": new go.Size(2, 2),
"animationManager.isEnabled": false,
"undoManager.isEnabled": true,
"ModelChanged": e => {
if (e.isTransactionFinished) {
document.getElementById("mySavedModel").value = myDiagram.model.toJson();
}
}
});
myDiagram.nodeTemplate =
new go.Node("Spot", {
locationSpot: go.Spot.Center,
toolTip: // show the X,Y coordinates of the node
go.GraphObject.build("ToolTip")
.add(
new go.TextBlock({ margin: 8, textAlign: "center" })
.bind("text", "", d => d.text + "\n" + d.loc)
)
})
.bindTwoWay("location", "loc", go.Point.parse, Stringify)
.add(
new go.Shape("Rectangle", { fill: "lime", width: CELL*2-1, height: CELL*2-1, portId: "" })
.bind("fill", "color"),
new go.TextBlock()
.bind("text", "key")
.bind("stroke", "color", c => go.Brush.isDark(c) ? "white" : "black")
);
myDiagram.linkTemplate =
new go.Link({ routing: go.Routing.Orthogonal, reshapable: true, resegmentable: true })
.bindTwoWay("points")
.add(
new go.Shape({ strokeWidth: 2 })
);
// The isometric view of the same model
// convert a Point in Cartesian view to isometric view
function CI(p) {
const x = p.x;
const y = p.y;
return new go.Point(y + x, y/2 - x/2);
}
// convert a Point in isometric view to Cartesian view
function IC(p) {
const x = p.x;
const y = p.y;
return new go.Point(x/2 - y, y + x/2);
}
// assume link geometries only have straight segments
class IsometricLink extends go.Link {
constructor(init) {
super();
if (init) Object.assign(this, init);
}
// Don't do it here! It's actually performed by the Link in myDiagram.
computePoints() { return true; }
makeGeometry() {
const geo = new go.Geometry();
let fig = null;
for (let i = 0; i < this.pointsCount; i++) {
const p = CI(this.getPoint(i));
if (fig === null) {
fig = new go.PathFigure(p.x, p.y, false);
geo.add(fig);
} else {
fig.add(new go.PathSegment(go.SegmentType.Line, p.x, p.y))
}
}
geo.offset(-this.routeBounds.x, -this.routeBounds.y);
return geo;
}
}
myIsoDiagram =
new go.Diagram("myIsoDiagramDiv", {
"ViewportBoundsChanged": e => {
GridPart.opacity = (e.diagram.scale > 1/CELL) ? 1 : 0;
},
"draggingTool.isGridSnapEnabled": true,
"draggingTool.gridSnapCellSize": new go.Size(2*2, 2),
"animationManager.isEnabled": false,
"undoManager.isEnabled": true
});
// define a limited background grid
GridPart = new go.Part({
layerName: "Grid",
location: new go.Point(0, 0), locationSpot: new go.Spot(0.5, 0.5, 0, CELL / 2)
})
.add(
new go.Shape({ stroke: "lightgray" })
);
function initGrid(radius) {
if (!radius) radius = 20000; // in document coordinates
const geo = new go.Geometry();
const max = Math.round(radius*2/CELL); // # lines to cover diameter area around origin in document coordinates
for (let i = 0; i < max+2; i++) { // include extra lines about the borders
geo.add(new go.PathFigure(0, (0 + i) * CELL, false, false).add(new go.PathSegment(go.SegmentType.Line, max*CELL*2, (max + i) * CELL)));
geo.add(new go.PathFigure(0, (max + i) * CELL, false, false).add(new go.PathSegment(go.SegmentType.Line, max*CELL*2, (0 + i) * CELL)));
}
GridPart.elt(0).geometry = geo;
myIsoDiagram.add(GridPart);
}
initGrid();
myIsoDiagram.nodeTemplate =
new go.Node("Spot", {
locationSpot: go.Spot.Center,
toolTip: // show the X,Y coordinates of the node
go.GraphObject.build("ToolTip")
.add(
new go.TextBlock({ margin: 8, textAlign: "center" })
.bind("text", "", d => d.text + "\n" + d.loc)
)
})
.bindTwoWay("location", "loc", s => CI(go.Point.parse(s)), p => Stringify(IC(p)))
.add(
new go.Shape("Diamond", { fill: "lime", width: CELL*2*2-1, height: CELL*2-1, portId: "" })
.bind("fill", "color"),
new go.TextBlock()
.bind("text", "key")
.bind("stroke", "color", c => go.Brush.isDark(c) ? "white" : "black")
);
myIsoDiagram.linkTemplate =
new IsometricLink({ routing: go.Routing.Orthogonal }) // not reshapable!
.bind("points") // not TwoWay!
.add(
new go.Shape({ strokeWidth: 2 })
);
// a Model that is shared by both Diagrams
myDiagram.model = myIsoDiagram.model = new go.GraphLinksModel({
pointsDigits: 1,
nodeDataArray:
[
{ key: 1, text: "Alpha", color: "lightblue" },
{ key: 2, text: "Beta", color: "orange" },
{ key: 3, text: "Gamma", color: "lightgreen" },
{ key: 4, text: "Delta", color: "pink" },
{ key: 5, text: "Epsilon", color: "yellow" },
],
linkDataArray:
[
{ from: 1, to: 2 },
{ from: 1, to: 3 },
{ from: 2, to: 4 },
{ from: 2, to: 5 },
]
});
</script>
</body>
</html>