Here’s what I tried:
<!DOCTYPE html>
<html>
<head>
<meta charset="UTF-8">
<title>Minimal GoJS Sample</title>
<meta name="description" content="An almost minimal diagram using a very simple node template and the default link template." />
<meta name="viewport" content="width=device-width, initial-scale=1">
<!-- Copyright 1998-2019 by Northwoods Software Corporation. -->
<script src="go.js"></script>
<script id="code">
function init() {
var $ = go.GraphObject.make;
var $define = go.GraphObject.defineBuilder;
var nodeWidth = 250;
var nodeHeight = 30;
var groupWidth = 250;
var groupHeight = 30;
myDiagram =
$(go.Diagram, "myDiagramDiv",
{
initialContentAlignment: go.Spot.Center,
"undoManager.isEnabled": true
}
);
$define("TableRowNode", function(args) {
return $(go.Node, "Spot",
{
fromSpot: go.Spot.RightCenter,
toSpot: go.Spot.LeftCenter,
avoidableMargin: new go.Margin(30, 2, 2, 2),
cursor: "pointer",
layerName: "Background",
selectionAdorned: false,
dragComputation: function (part) {
return part.location;
}
},
new go.Binding("row")
);
});
myDiagram.nodeTemplate =
$("TableRowNode",
$(go.Panel, "Auto",
$(go.Shape, "Rectangle",
{ fill: "#FFFFFF", stroke: '#CCCCCC', strokeWidth: 0.5 },
),
$(go.Panel, "Horizontal",
{
width: nodeWidth,
height: nodeHeight,
row: 0,
column: 0
},
$(go.Panel, go.Panel.Table,
$(go.RowColumnDefinition, { column: 0, width: nodeWidth - 60 }),
$(go.RowColumnDefinition, { column: 1, width: 30 }),
$(go.RowColumnDefinition, { column: 2, width: 30 }),
$(go.TextBlock,
{
font: "bold 12px Sans-Serif",
row: 0,
column: 0,
margin: 5,
alignment: go.Spot.Left,
width: nodeWidth - 60,
maxLines: 1,
overflow: go.TextBlock.OverflowEllipsis,
stroke: "#323232"
},
new go.Binding("text", "text"),
),
$(go.Shape, "Circle",
{
width: 20,
height: 20,
margin: new go.Margin(10, 0, 10, 10),
strokeWidth: 0,
row: 0,
column: 1,
fill: 'gray',
visible: false
},
new go.Binding("visible", "controllo", function (s) {
return !!s;
})
),
// $(go.Picture,
// {
// row: 0,
// column: 1,
// margin: new go.Margin(10, 0, 10, 10),
// source: "./assets/images/check-white.png",
// width: 20,
// height: 20,
// visible: false
// },
// new go.Binding("visible", "controllo", function (s) {
// return !!s;
// })
// ),
$(go.Shape, "Circle",
{
width: 20,
height: 20,
margin: new go.Margin(10, 10, 10, 10),
strokeWidth: 0,
row: 0,
column: 2,
fill: 'gray',
visible: false
},
new go.Binding("visible", "manualita", function (s) {
return !!s;
})
)
// $(go.Picture,
// {
// width: 15,
// height: 15,
// margin: new go.Margin(10, 10, 10, 12),
// source: "./assets/images/hand-white.png",
// row: 0,
// column: 2,
// visible: false
// },
// new go.Binding("visible", "manualita", function (m) {
// return !!m;
// })
// )
)
)
)
);
myDiagram.groupTemplate =
$(go.Group, "Auto",
{
avoidable: false,
computesBoundsIncludingLinks: false,
selectionAdorned: false,
layout: $(go.GridLayout, {
wrappingColumn: 1,
spacing: go.Size.parse("0 0")
}),
margin: new go.Margin(0, 100, 30, 0),
layerName: "Background"
},
new go.Binding("row"),
new go.Binding("column", "col"),
$(go.Shape, "Rectangle",
{
fill: "#F2F2F2", stroke: "transparent", strokeWidth: 0.5,
portId: "",
fromSpot: go.Spot.RightCenter,
toSpot: go.Spot.LeftCenter
}
),
$(go.Panel, "Table",
{
toolTip:
$(go.Adornment, "Auto",
$(go.Shape, { fill: "#323232", strokeWidth: 0 }),
$(go.TextBlock,
{ margin: 8, stroke: "#FFFFFF" },
new go.Binding("text")
)
)
},
$(go.Shape, "Rectangle",
{
stroke: "transparent",
strokeWidth: 3,
desiredSize: new go.Size(groupWidth, groupHeight)
},
new go.Binding("fill", "type", function (type) {
return type === 2
? "#8BDBF7"
: type === 3
? "#BEE5F2"
: type === 5
? "#FEE6BD"
: "#E3E3E3";
}),
new go.Binding("stroke", "", function (node) {
return node.active
? "#418AA3"
: node.type === 2
? "#8BDBF7"
: node.type === 3
? "#BEE5F2"
: node.type === 5
? "#FEE6BD"
: "#E3E3E3";
})
),
$(go.Panel, "Table",
$(go.TextBlock,
{
row: 0, column: 0, font: "bold 14px Sans-Serif",
textAlign: "left",
width: groupWidth - 44,
stroke: "#323232",
maxLines: 2,
overflow: go.TextBlock.OverflowEllipsis,
margin: 8
},
new go.Binding("text")
),
$("Button", { row: 0, column: 1, margin: 5, desiredSize: new go.Size(10, 10), cursor: "pointer" })
),
$(go.Placeholder,
{ row: 1, columnSpan: 2, padding: 0, margin: 0, alignment: go.Spot.TopLeft }
)
)
);
// but use the default Link template, by not setting Diagram.linkTemplate
myDiagram.linkTemplate =
$(go.Link,
{
selectable: false,
routing: go.Link.AvoidsNodes,
fromSpot: go.Spot.Right,
toSpot: go.Spot.Left
},
new go.Binding("fromEndSegmentLength", "", function (link) {
if(link.fromGroup === link.toGroup) {
return 20;
} else {
return 40;
}
}),
new go.Binding("toEndSegmentLength", "", function (link) {
if(link.fromGroup === link.toGroup) {
return 20;
} else {
return 40;
}
}),
$(go.Shape)
);
// create the model data that will be represented by Nodes and Links
myDiagram.model = new go.GraphLinksModel(
[
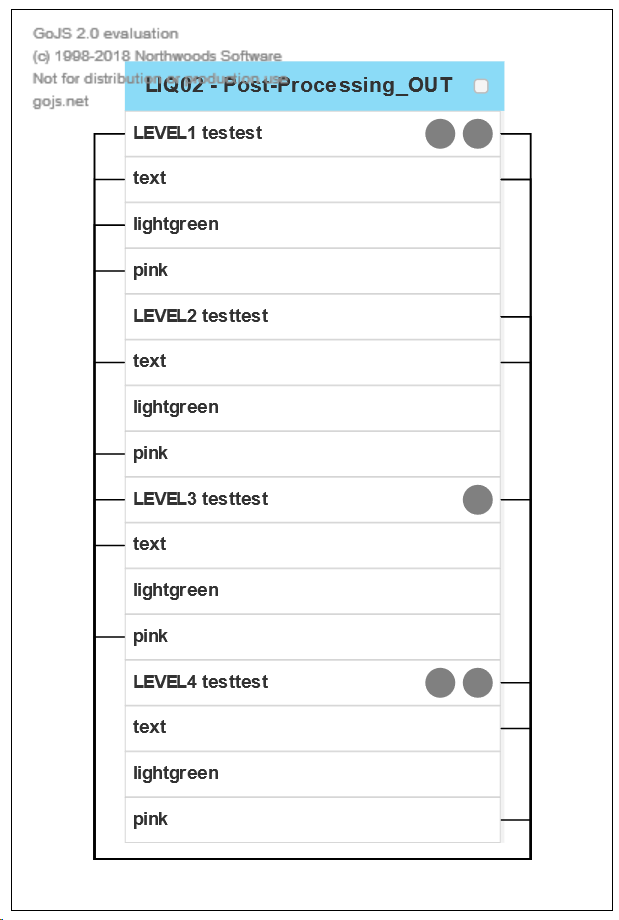
{ key: "Group1", text: "LIQ02 - Post-Processing_OUT", isGroup: true, type: 2 },
{ key: 0, text: "LEVEL1 testest", controllo: true, manualita: true, group: "Group1" },
{ key: 1, text: "text", group: "Group1" },
{ key: 2, text: "lightgreen", group: "Group1" },
{ key: 3, text: "pink", group: "Group1" },
{ key: 4, text: "LEVEL2 testtest", group: "Group1" },
{ key: 5, text: "text", group: "Group1" },
{ key: 6, text: "lightgreen", group: "Group1" },
{ key: 7, text: "pink", group: "Group1" },
{ key: 8, text: "LEVEL3 testtest", manualita: true, group: "Group1" },
{ key: 9, text: "text", group: "Group1" },
{ key: 10, text: "lightgreen", group: "Group1" },
{ key: 11, text: "pink", group: "Group1" },
{ key: 12, text: "LEVEL4 testtest", controllo: true, manualita: true, group: "Group1" },
{ key: 13, text: "text", group: "Group1" },
{ key: 14, text: "lightgreen", group: "Group1" },
{ key: 15, text: "pink", group: "Group1" }
],
[
{ from: 0, to: 1, fromGroup: "Group1", toGroup: "Group1" },
{ from: 0, to: 2, fromGroup: "Group1", toGroup: "Group1" },
{ from: 1, to: 2, fromGroup: "Group1", toGroup: "Group1" },
{ from: 1, to: 5, fromGroup: "Group1", toGroup: "Group1" },
{ from: 4, to: 7, fromGroup: "Group1", toGroup: "Group1" },
{ from: 4, to: 9, fromGroup: "Group1", toGroup: "Group1" },
{ from: 5, to: 8, fromGroup: "Group1", toGroup: "Group1" },
{ from: 8, to: 11, fromGroup: "Group1", toGroup: "Group1" },
{ from: 12, to: 3, fromGroup: "Group1", toGroup: "Group1" },
{ from: 13, to: 0, fromGroup: "Group1", toGroup: "Group1" },
{ from: 15, to: 0, fromGroup: "Group1", toGroup: "Group1" },
]);
}
</script>
</head>
<body onload="init()">
<div id="sample">
<!-- The DIV for the Diagram needs an explicit size or else we won't see anything.
This also adds a border to help see the edges of the viewport. -->
<div id="myDiagramDiv" style="border: solid 1px black; width:400px; height:600px"></div>
</div>
</body>
</html>
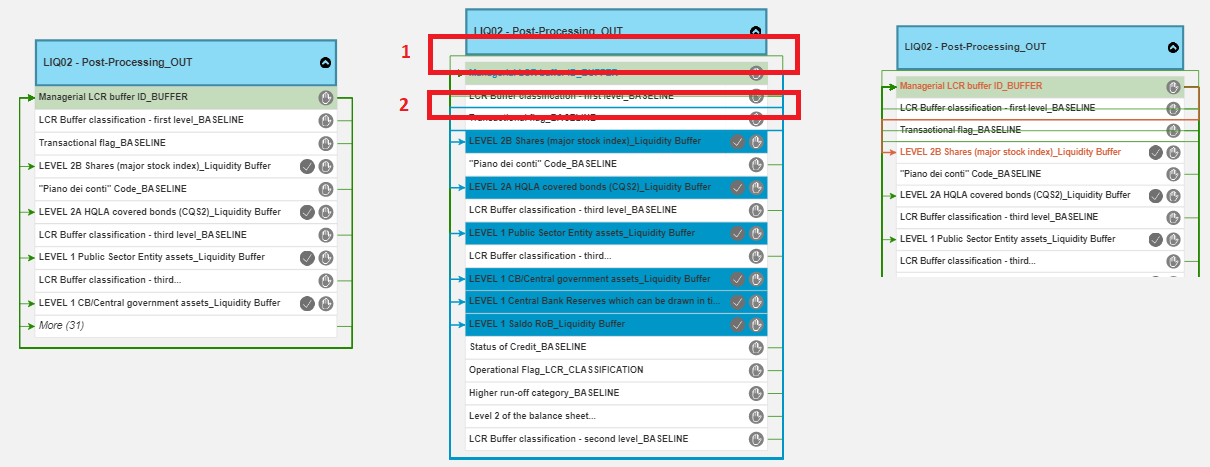
I commented out the images and set the group to avoidable: false, computesBoundsIncludingLinks: false. It produced this, with no links crossing the nodes: