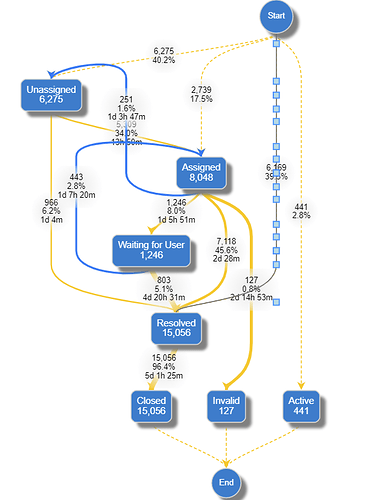
I’m trying to use the CurveLinkReshaping externsion in a diagram with layout = ‘LayeredDigraphLayout’. As the number of pointlinks is <> 4, it doesn’t; work. Furthermore, the overall moving of links is cumbersome and sometimes 10+ points appear (below) Any ideas/suggestions. Ideally I’d like the exact same functionality as per the CurveLinkReshaping extension
I don’t understand what you would want to happen when there are multiple curved or straight segments in a link path. If there were only one reshape handle for such a link, how could the CurvedLinkReshapingTool know which segment the user wanted to reshape?
Or are you asking that the CurvedLinkReshapingTool be extended so that it handle multisegment links? If so, you are the first person to ask for such an enhancement. We’ll look into it.
[ADDENDUM]
In thinking about this some more, it occurred to me that there is at least a third possibility: that you want the user, when reshaping a link with multiple segments, to cause the link route to become a simple single Bezier curve. In other words, to throw away all of those segments and just have a single segment instead.
If you want this behavior, all you have to do in your copy of CurvedLinkReshapingTool is replace the two expressions:
link.pointsCount === 4
with:
(link.pointsCount-1)%3 === 0
That seems to do the job in this sample:
<!DOCTYPE html>
<html>
<head>
  <title>Customized CurvedLinkReshapingTool</title>
  <!-- Copyright 1998-2022 by Northwoods Software Corporation. -->
</head>
<body>
  <div id="myDiagramDiv" style="border: solid 1px black; width:100%; height:900px"></div>

  <script src="https://unpkg.com/gojs"></script>
  <script src="CurvedLinkReshapingTool.js"></script>
  <script id="code">

const $ = go.GraphObject.make;

const myDiagram =
  $(go.Diagram, "myDiagramDiv",
    {
      initialScale: 2,
      // tool modified to work with 3n+1 points rather than only 4 points:
      linkReshapingTool: $(CurvedLinkReshapingTool),
      layout: $(go.LayeredDigraphLayout, { direction: 90, setsPortSpots: false })
    });

myDiagram.nodeTemplate =
  $(go.Node,
    $(go.TextBlock,
      new go.Binding("text", "key"))
  );

myDiagram.linkTemplate =
  $(go.Link,
    { curve: go.Link.Bezier, curviness: 0, reshapable: true, selectionAdorned: false },
    $(go.Shape)
  );

// the array of link data objects: the relationships between the nodes
var linkDataArray = [
  { from: "A", to: "B" },
  { from: "A", to: "E" },
  { from: "A", to: "D" },
  { from: "B", to: "C" },
  { from: "B", to: "D" },
  { from: "C", to: "E" },
];

// create the model and assign it to the Diagram
myDiagram.model =
  new go.GraphLinksModel(
    { // automatically create node data objects for each "from" or "to" reference
      // (set this property before setting the linkDataArray)
      archetypeNodeData: {},
      linkDataArray: linkDataArray
    });
  </script>
</body>
</html>
Hi Walter,
I tried this. It show’s a single point but the curve becomes a straight line when moved. I’ll send an example via email
Thanks
Ian
