I have a circle shape node template. I want t o render a lottie animation at its center. is this possible in GOJS ?
I’m unfamiliar with Lottie animations. We’ll investigate it.
Here’s a demo:
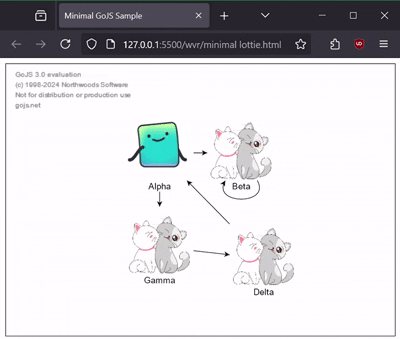
This uses canvas rendering. There’s probably a more efficient solution when rendering as SVG, but I’m not sure how to get the Lottie engine to render in SVG.
<!DOCTYPE html>
<html>
<head>
  <title>Minimal Lottie in GoJS Sample</title>
  <!-- Copyright 1998-2025 by Northwoods Software Corporation. -->
</head>
<body>
  <div id="myDiagramDiv" style="border: solid 1px black; width:100%; height:400px"></div>

  <script type="importmap">{"imports":{
    "gojs":"https://cdn.jsdelivr.net/npm/[email protected]/release/go-module.js",
    "lottie":"https://cdn.jsdelivr.net/npm/@lottiefiles/dotlottie-web/dist/index.js"
  }}</script>
  <script id="code" type="module">
import { DotLottie } from "lottie";
import * as go from "gojs";

const myDiagram =
  new go.Diagram("myDiagramDiv", {
      "undoManager.isEnabled": true
    });

function convertFromLottie(src, pic) {
  const diag = pic.diagram;
  if (!diag || !diag.div) return null;
  const cnv = Lotties.get(src);
  if (cnv) return cnv;
  const canvas = document.createElement("canvas");
  canvas.style = "width: 100px; height: 100px; visibility: hidden; position: absolute; left: 0px; top: 0px;";
  const dotLottie = new DotLottie({
    autoplay: true,
    loop: true,
    canvas: canvas,
    src: src
  });
  Lotties.set(src, canvas);
  diag.div.appendChild(canvas);
  return canvas;
}
const Lotties = new Map();

myDiagram.nodeTemplate =
  new go.Node("Vertical")
    .add(
      new go.Picture({ name: "PIC", width: 100, height: 100 })
        .bind("element", "src", convertFromLottie),
      new go.TextBlock({ margin: 2 })
        .bind("text")
    );

myDiagram.model = new go.GraphLinksModel(
[
  { key: 1, text: "Alpha", color: "lightblue", src: "https://lottie.host/4db68bbd-31f6-4cd8-84eb-189de081159a/IGmMCqhzpt.lottie" },
  { key: 2, text: "Beta", color: "orange", src: "Animation1739540457740.lottie" },
  { key: 3, text: "Gamma", color: "lightgreen", src: "Animation1739540457740.lottie" },
  { key: 4, text: "Delta", color: "pink", src: "Animation1739540457740.lottie" },
],
[
  { from: 1, to: 2 },
  { from: 1, to: 3 },
  { from: 2, to: 2 },
  { from: 3, to: 4 },
  { from: 4, to: 1 }
]);

setInterval(() => myDiagram.nodes.each(n => {
  const pic = n.findObject("PIC");
  if (pic) pic.redraw();
}), 1000/30)
  </script>
</body>
</html>
while this seems to work but its not quite what i am looking for.
Let me try explaining my scenario.
I am trying to make an api call using each node’s id.
While the api response is being fetched, I want to animate that particular node for the user to visually see which node is currently being processed.
I want to add an animation something like you see in the attached gif and i need the animation to be smooth which normally is achieved via lottie animations. But if you have a better workaround i am all ears.
Why won’t Walter’s solution work? Other than being a bit kludgey, you could add a go.Picture with a lottie animation to some adornment on the Node.
Though if this is for a temporary item only, it might be best to actually display an HTML element over the Diagram (containing the Lottie animation), and then remove it when its no longer needed.
This comes with other potential issues (will this thing be long lived? Does it need to move with the node?), so it may not be appropriate. But it might be a nice separation of concerns otherwise.
For example, look at the spinner shown when loading a large model: Virtualized Diagram no Layout | GoJS Diagramming Library
this is the part i am worried about, especially considering that my canvas could have anywhere between 50 - 200 nodes, probably more.
setInterval(() => myDiagram.nodes.each(n => {
const pic = n.findObject(“PIC”);
if (pic) pic.redraw();
}), 1000/30)
Moreover, i want the animation only while the api response is being fetched, once fetched, the lottie should stop and disappear and re-appear when the api request is again fired with the node’s id.
Again its not necessary to use a lottie, I can even use a gif like the one shared above, I am just not sure how I can do the above in GOJS.
How does the sample Virtualized Diagram no Layout | GoJS Diagramming Library not provide exactly what you are asking for?
Please see the recording at this link. This is exactly what i want to achieve
Assume your animated GIF is named “spin.gif” in the same directory as this page:
<!DOCTYPE html>
<html>
<head>
<title>Minimal Spinner for each Node</title>
<!-- Copyright 1998-2025 by Northwoods Software Corporation. -->
</head>
<body>
<div id="myDiagramDiv" style="border: solid 1px black; width:100%; height:400px"></div>
<script src="https://cdn.jsdelivr.net/npm/gojs/release/go.js"></script>
<script id="code">
const myDiagram =
new go.Diagram("myDiagramDiv", {
renderer: "svg",
layout: new go.LayeredDigraphLayout(),
"undoManager.isEnabled": true
});
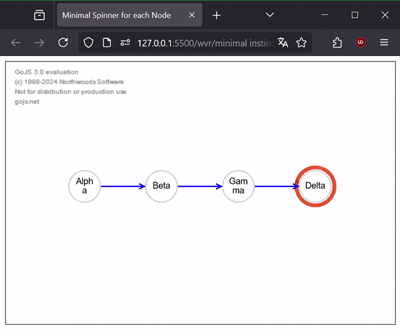
myDiagram.nodeTemplate =
new go.Node("Spot")
.add(
new go.Panel("Auto", { width: 50, height: 50 })
.add(
new go.Shape("Circle", {
fill: "white", stroke: "lightgray", strokeWidth: 2,
portId: ""
}),
new go.TextBlock({ textAlign: "center" })
.bind("text")
),
new go.Picture("spin.gif", { width: 72, height: 72 })
.bindObject("opacity", "isHighlighted", h => h ? 1 : 0)
);
myDiagram.linkTemplate =
new go.Link()
.add(
new go.Shape({ stroke: "blue", strokeWidth: 2 }),
new go.Shape({ toArrow: "OpenTriangle", stroke: "blue", strokeWidth: 2 })
);
myDiagram.model = new go.GraphLinksModel(
[
{ key: 1, text: "Alpha", color: "lightblue" },
{ key: 2, text: "Beta", color: "orange" },
{ key: 3, text: "Gamma", color: "lightgreen" },
{ key: 4, text: "Delta", color: "pink" }
],
[
{ from: 1, to: 2 },
{ from: 2, to: 3 },
{ from: 3, to: 4 },
]);
setInterval(() => {
myDiagram.nodes.each(node => node.isHighlighted = Math.random() < 0.25)
}, 1000);
</script>
</body>
</html>
Is there a way to do the above without svg renderer.
For some reason, whenever, i change renderer to svg, the entire canvas slows down drastically when the node count is above 50.
Which version of GoJS are you using?
In our experience SVG rendering performance with two hundred nodes is good. Do you have one spinner per node?
“gojs”: “3.0.19”,
“gojs-react”: “^1.1.2”,
each node has a property _state
all node has a Panel, who visibility depend on the value of the _state property
spinnerPanel.js

import * as go from "gojs";
const $ = go.GraphObject.make;

export const spinnerPanel = $(
  go.Panel,
  "Spot",
  {
    alignment: new go.Spot(0.8, 0.1),
    name: "RUNPANELGO",
    isActionable: true,
    cursor: "pointer",
    isClipping: true,
  },
  $(go.Shape, "Circle", {
    width: 40,
    height: 40,
  }),
  $(
    go.Picture,
    { width: 40, height: 40, source: runningGif },
  )
);

const runningAdornment = $(
  go.Adornment,
  "Spot",
  $(go.Placeholder),
  spinnerPanel
);


// initDiagram
ModelChanged: (e) => {
          if (e.isTransactionFinished) {
            onModelChanged(e.model);
          }
          if (
            e.change === go.ChangeType.Property &&
            e.propertyName === "_state"
          ) {
            const node = d.findPartForKey(e.object.key);
            if (node instanceof go.Node) {
              if (e.newValue === "running") {
                // show the overlay spinner adornment
                runningAdornment.adornedObject = node;
                node.addAdornment("running", runningAdornment);
              } else {
                // hide it
                node.removeAdornment("running");
                runningAdornment.adornedObject = null;
              }
            }
          }
        },
the gif doesn’t animate for me.
Could you please help or suggest an alternate approach to show a circular loader at the top right corner of the node
Just a heads up, below is another alternate method I am trying to avoid the gif implementation completely, but facing challenge on how to call the animation manager
const spinnerPanel = $(
  go.Panel,
  "Spot",
  { alignment: new go.Spot(0.7, 0.1) }, // position relative to the node
  // a transparent circle with a single dashed arc
  $(go.Shape, "Circle", {
    width: 40,
    height: 40,
    fill: "green",
    stroke: "transparent",
    strokeWidth: 0,
  }),
  $(
    go.Shape,
    "Circle",
    {
      name: "SPINNER",
      width: 30,
      height: 30,
      fill: null,
      stroke: "white",
      strokeWidth: 4,
      // dash length + gap length ≈ circumference to draw a single arc
      strokeDashArray: [80, 20],
      angle: 0, // start angle
    },
    // visible only when data._state === "running"
    new go.Binding("visible", "", (d) => d._state === "running")
  )
);
<!DOCTYPE html>
<html>

<head>
  <title>Spinning Runner</title>
  <!-- Copyright 1998-2025 by Northwoods Software Corporation. -->
  <meta name="description" content="">
  <meta name="viewport" content="width=device-width, initial-scale=1">
</head>

<body>
  <div id="myDiagramDiv" style="border: solid 1px black; width:100%; height:600px"></div>

  <script src="https://cdn.jsdelivr.net/npm/gojs"></script>
  <script id="code">

let MarqueeAnimation = null;
myDiagram =
  new go.Diagram("myDiagramDiv", {
      "undoManager.isEnabled": true,
      "ModelChanged": e => {
        if (!e.isTransactionFinished) return;
        const anim = new go.Animation();
        let animnodes = 0;
        anim.duration = 500;
        anim.easing = go.Animation.EaseLinear;
        anim.runCount = Infinity;
        myDiagram.nodes.each(n => {
          const spn = n.findObject("SPINNER");
          if (spn !== null && spn.opacity === 1) {
            anim.add(spn, "strokeDashOffset", 100, 0);
            animnodes++;
          }
        });
        if (MarqueeAnimation) MarqueeAnimation.stop();
        if (animnodes > 0) {
          MarqueeAnimation = anim;
          MarqueeAnimation.start();
        } else {
          MarqueeAnimation = null;
        }
      }
    });

myDiagram.nodeTemplate =
  new go.Node("Spot")
    .add(
      // the body doesn't really matter for this demo
      new go.Panel("Auto", { width: 100, height: 60 })
        .add(
          new go.Shape({ fill: "white", portId: "", fromLinkable: true, toLinkable: true, cursor: "pointer" })
            .bind("fill", "color"),
          new go.TextBlock({ margin: 8, editable: true })
            .bindTwoWay("text"),
        ),
      new go.Panel("Spot", {
          alignment: new go.Spot(0.7, 0.1) // position relative to the node
        })
        .add(
          // a transparent circle with a single dashed arc
          new go.Shape("Circle", {
            width: 40,
            height: 40,
            fill: "green",
            strokeWidth: 0,
          }),
          new go.Shape("Circle", {
              name: "SPINNER",
              width: 30,
              height: 30,
              fill: null,
              stroke: "white",
              strokeWidth: 4,
              // dash length + gap length ≈ circumference to draw a single arc
              strokeDashArray: [80, 20],
            })
            // NOTE opaque only when data._state === "running"
            .bind("opacity", "", d => d._state === "running" ? 1 : 0)
        )
    );

// create a bunch of nodes
const nda = [];
for (let i = 0; i < 256; i++) {
  nda.push({ text: "Alpha", color: "lightblue" });
  nda.push({ text: "Beta", color: "orange" });
  nda.push({ text: "Gamma", color: "lightgreen" });
  nda.push({ text: "Delta", color: "pink" });
}
myDiagram.model = new go.GraphLinksModel(nda);

// every second randomly change which nodes are running/spinning
function runRandomly() {
  myDiagram.model.commit(m => {
    m.nodeDataArray.forEach(d => m.set(d, "_state", Math.random() < 0.25 ? "running" : "stopped"));
  });
  setTimeout(runRandomly, 1000);
}
runRandomly();
  </script>
</body>

</html>
Thanks a lot, the above worked.
I was still wondering, if we could use gif images without the need for svg renderer ?
Yes, I believe you just have to call Picture.redraw on them, often enough.