The measuredBounds for a Shape will always be expanded from the Shape.geometry to account for the Shape.strokeWidth.
You could try setting the width to zero, because the default Shape.strokeWidth is 1. The width and height and desiredSize are values in the shape’s local coordinate system, before any transforms are applied and any strokeWidth is considered.
Maybe my approach is wrong for what I am trying to achieve.
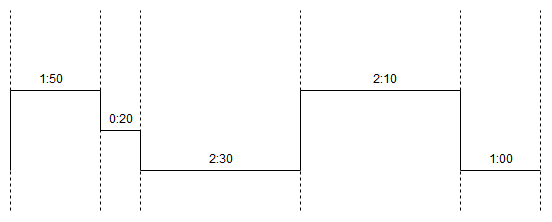
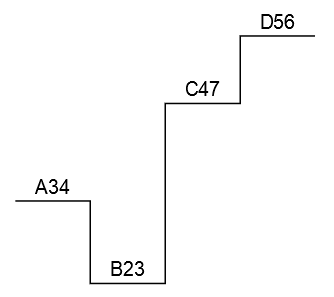
Basically I need to visualize a step function. This is the desired result (without the dotted lines):
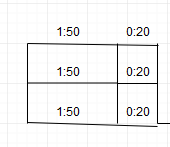
Input data looks like this currently (but could be adjusted as it is dynmically generated):
My idea was to make a part with horizontal panels (indicated by the dotted lines). The panels would have lines on all possible locations and then bind the visibility/opacity of the lines the the model data to show only the relevant lines.
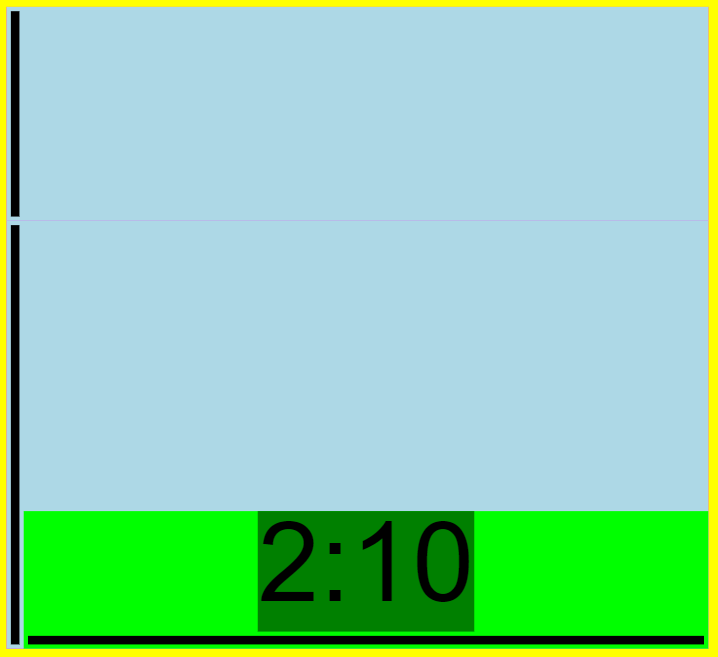
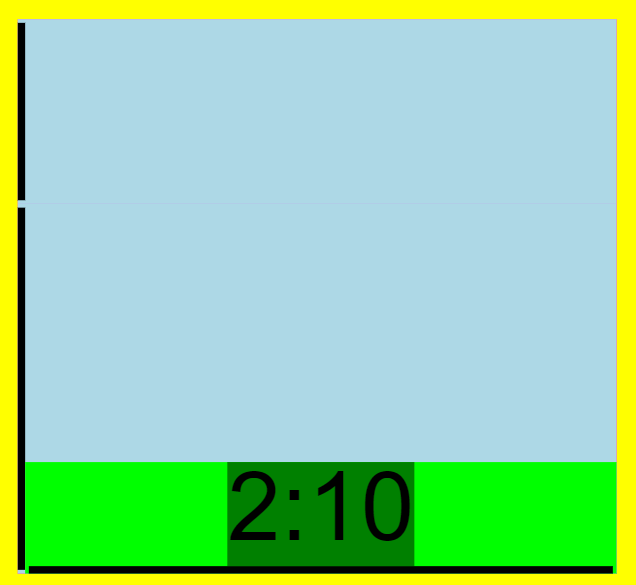
I thoght I could draw something like this and then just hide the lines/texts:
Hi, the segments are static, they cannot be moved or deleted, and the color is (at least currently) always the same. I was considering a single Geometry, but how would I add the time text above each horizontal line? Just calculate the absolute position of the textboxes or is there another way?
Hi, if I should just calculate the absolute position of the TextBlocks and place them within the Shape I think I am able to do this.
If there is a better solution where I can place a TextBlock relative to a Geometry PathSegment it would be great if you could provide an example.
No, you’ll need to calculate them, just as you do when you calculate the points of the line.
By the way, for anyone else reading this topic, the answer to your original question is to set Shape.strokeCap to “square”. But I think you’ll be happier with the more efficient technique of creating a single Shape with a Path Geometry running the whole way.
So there’s a single Part whose Panel.itemArray is bound to your Array of data. The Panel.itemTemplate would be a simple Panel holding a TextBlock bound to the data and with a Binding that assigns the panel’s position in the Part.
  function init() {
    var $ = go.GraphObject.make;

    myDiagram =
      $(go.Diagram, "myDiagramDiv",
        { initialContentAlignment: go.Spot.Center }); // for v1.*

    var DX = 50;  // width of each segment
    var DY = -50; // factor to compute height of each segment; positive values need to go up, hence negative

    // Min and max of data array range is cached on data object.
    // When adding items to array, clear cache by setting one of these properties to undefined.
    function findShift(data) {
      if (data.max === undefined || data.min === undefined) {
        var max = -Infinity;
        var min = Infinity;
        var arr = data.arr;
        for (var i = 0; i < arr.length; i++) {
          var d = arr[i];
          if (d.v > max) max = d.v;
          if (d.v < min) min = d.v;
        }
        data.max = max;
        data.min = min;
      }
      return data.max * -DY;
    }

    myDiagram.nodeTemplate =
      $(go.Part, "Spot",
        $(go.Shape, { fill: null },
          new go.Binding("geometry", "", function(data) {
            var range = findShift(data);
            var fig = null;
            var arr = data.arr;
            for (var i = 0; i < arr.length; i++) {
              var d = arr[i];
              var x = i * DX;
              var y = d.v * DY + range;
              if (fig === null) {
                fig = new go.PathFigure(x, y);
                fig.add(new go.PathSegment(go.PathSegment.Line, x + DX, y));
              } else {
                fig.add(new go.PathSegment(go.PathSegment.Line, x, y));
                fig.add(new go.PathSegment(go.PathSegment.Line, x + DX, y));
              }
            }
            return new go.Geometry().add(fig);
          })),
          new go.Binding("itemArray", "arr"),
          {
            itemTemplate:
              $(go.Panel,
                new go.Binding("alignment", "", function(panel) {
                  var range = findShift(panel.part.data);
                  return new go.Spot(0, 0, panel.itemIndex * DX + DX / 2, panel.data.v * DY + range - 8);
                }).ofObject(),
                $(go.TextBlock, new go.Binding("text"))
              )
          }
      );

    myDiagram.model = new go.GraphLinksModel(
      [
        {
          key: 1, text: "Alpha",
          arr: [
            { text: "A34", v: 3.4 },
            { text: "B23", v: 2.3 },
            { text: "C47", v: 4.7 },
            { text: "D56", v: 5.6 }
          ]
        }
      ]);
  }
produces:
Now I scroll up a bit and see I totally forgot that each segment could have a different width. Sorry.