Thanks for the reply. Setting the width to 0 removed the left/right margin, but the vertical line still has some bottom/top margin:
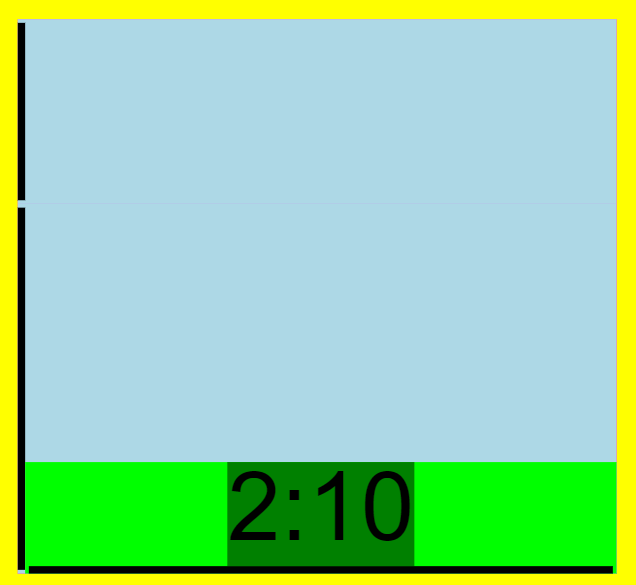
Any idea how to remove this as well?
Maybe my approach is wrong for what I am trying to achieve.
Basically I need to visualize a step function. This is the desired result (without the dotted lines):
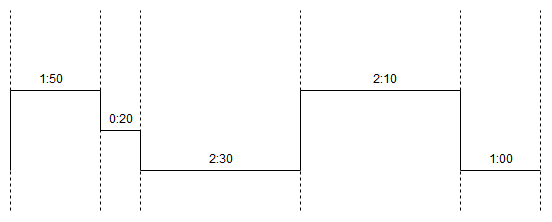
Input data looks like this currently (but could be adjusted as it is dynmically generated):
[
            {
                time: "1:50",
                width: 70,
                edge: "full",
                position: "top"
            },
            {
                time: "0:20",
                width:25,
                edge: "top",
                position: "middle"
            },
            {
                time: "2:30",
                width: 200,
                edge: "bottom",
                position: "bottom"
            },
            ...
        ];
My idea was to make a part with horizontal panels (indicated by the dotted lines). The panels would have lines on all possible locations and then bind the visibility/opacity of the lines the the model data to show only the relevant lines.
I thoght I could draw something like this and then just hide the lines/texts:
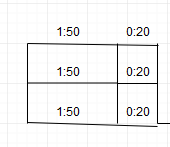
Maybe there is a better solution?